3 Questions That Reveal Business Quality (Without Touching Excel)
How to Avoid Fake “Quality” Stocks

It looked like a compounder. It wasn’t..
Through my years in the market, I’ve seen this story repeat again and again.
A company looks perfect on paper:
High margins
Strong growth
“Recurring revenue”
Great narrative and premium valuation.
Investors call it a high-quality business.
The word “compounder” gets thrown around in every podcast.
Then, slowly, reality catches up:
Competition creeps in.
Customers churn.
Margins compress.
The stock is down 50% YTD
And everyone acts surprised..
But did the business change overnight?
No.
The real problem is that most investors confuse today’s quality with durability.
Checking today’s numbers is easy.
Any screener can give you margins, growth rates, and revenue mix in seconds.
But real business quality isn’t what a company looks like today.
It’s whether those numbers still hold 5 years from now.
Answering that used to take weeks: filings, transcripts, competitors, industry research.
So people default to snapshots.
Not because it’s right , because it’s fast.
But with AI, that tradeoff disappears.
You can now test business durability in minutes using real sources and verified evidence.
That’s what The 3 Gates Test is.
3 simple questions, each with a ready-to-use prompt, that help you spot businesses that look like compounders but aren’t:
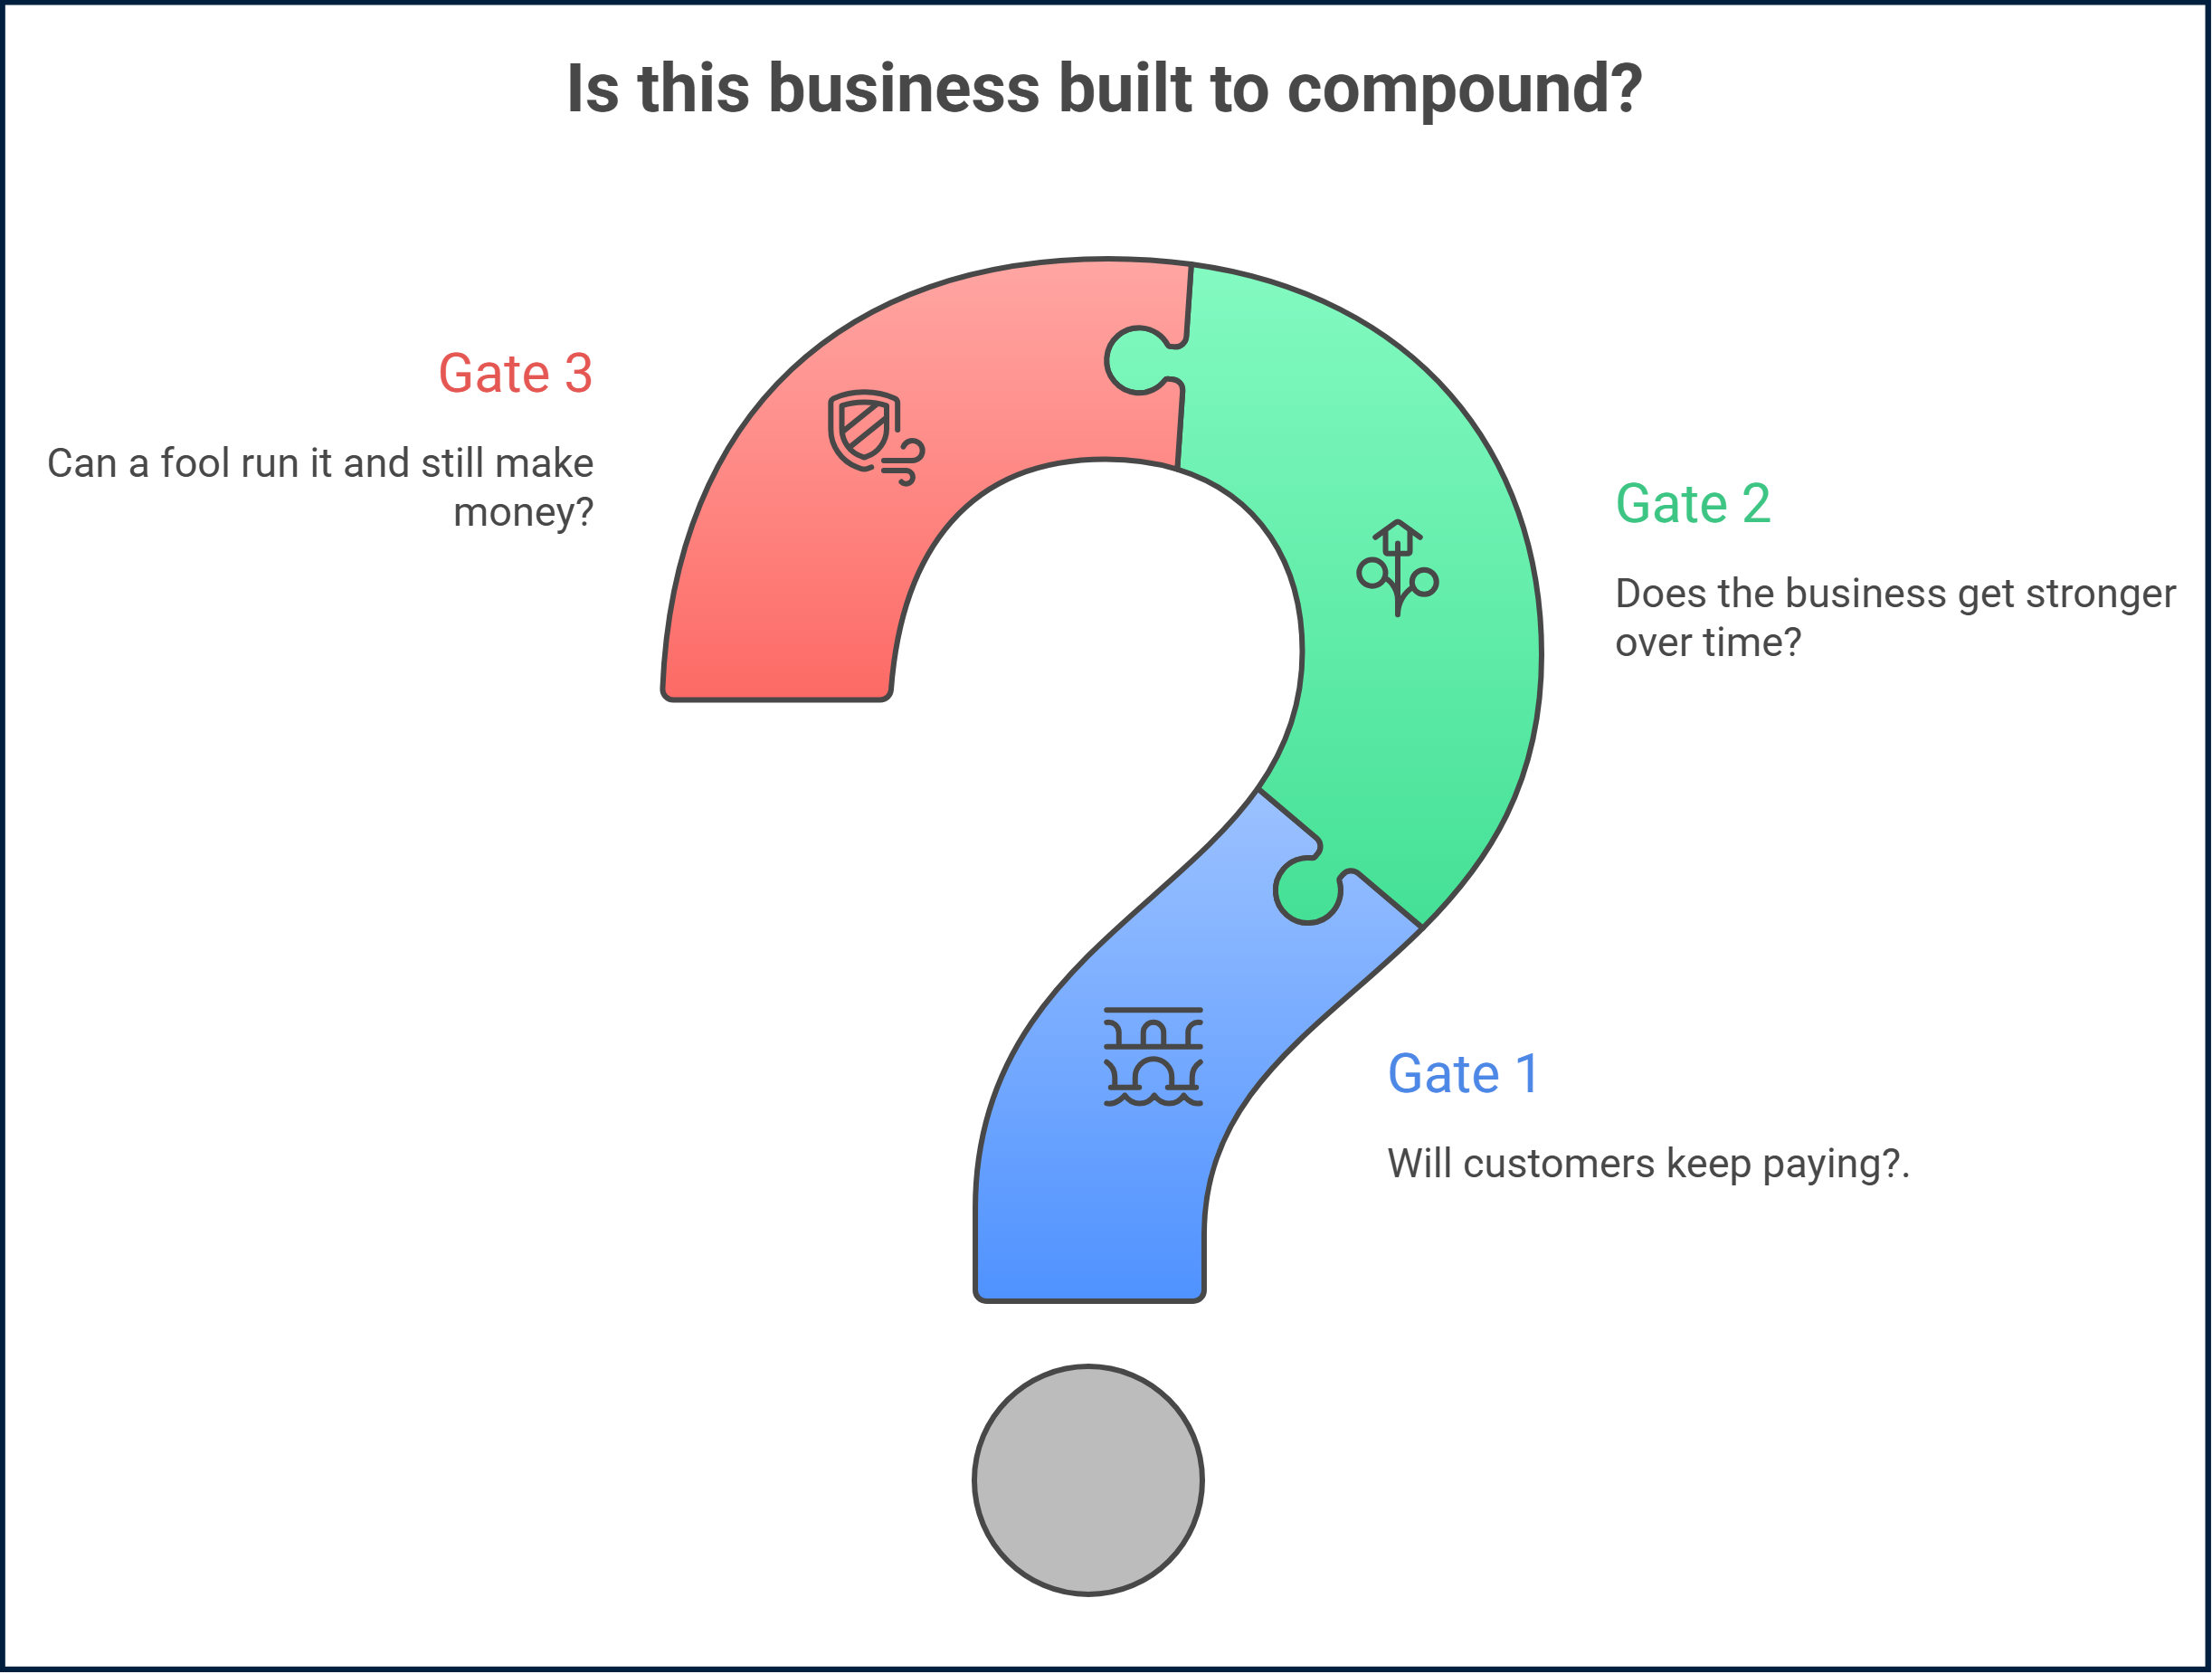
Gate 1 : If marketing stops, does the money keep coming in?
Gate 2 : Does time make this business stronger ?
Gate 3 :Can this business survive stupidity?
These gates don’t tell if the stock is cheap.
They tell something more important: is this business built to compound ?
Let’s get into it.
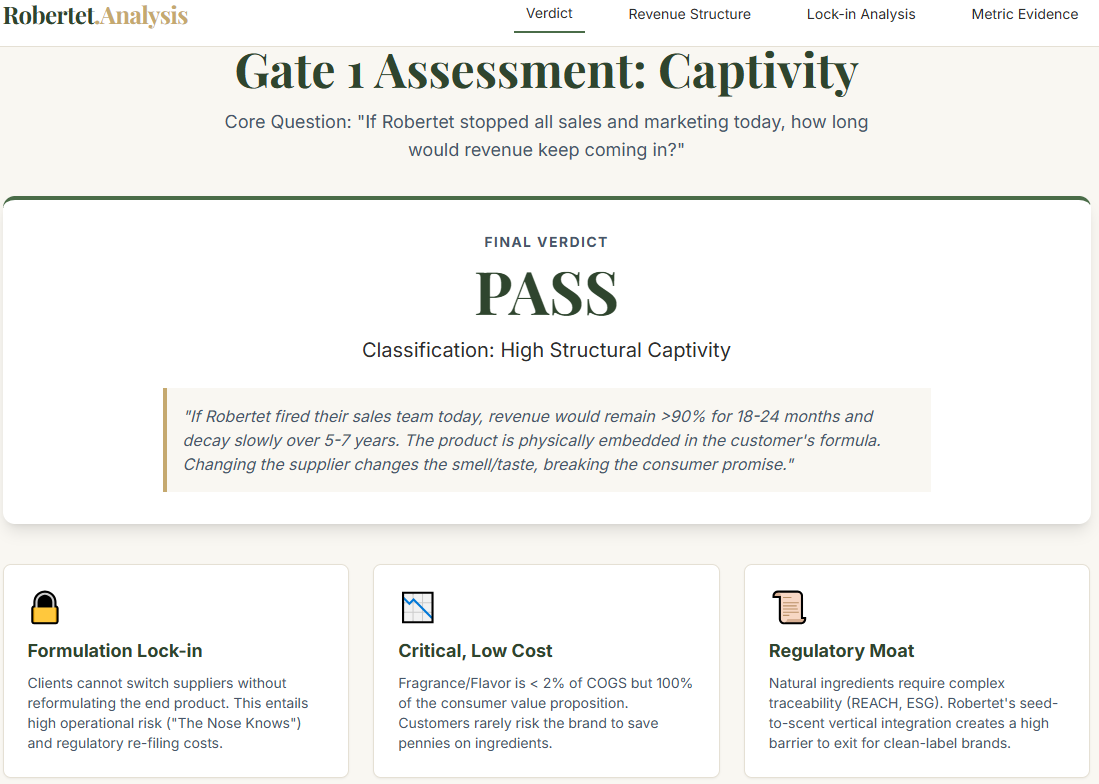
Gate 1 :The Sticky Revenue Gate
This step will answer a very importante question:
If this company stopped marketing today… would money still come in?
“Recurring revenue” is one of the most abused terms in investing.
Investors see”Subscription” and their brain shuts off.
They assume it means stability.
But “recurring” doesn’t mean “captive.”
A gym membership is recurring because people pay monthly.
It looks great on paper no ?
But customers cancel all the time.
The gym has to keep filling the bucket because it never stops leaking.
Now think about a company that installs critical equipment in your building.
The Elevator.
No SaaS metrics.
No subscription hype.
But once an elevator is installed, the building is locked in.
Maintenance is mandatory.
Parts are specialized.
Switching is expensive and risky.
No one wakes up and says: “Let’s change elevator providers.”
The customer decided once and never revisits the decision.
That’s captive revenue.
And it’s the foundation of every real compounder.
Use this prompt in Deep Research to:
Expose whether revenue is truly captive (or dependent on constant re-selling)
Break down exactly where churn would come from if growth slows
Force proof using filings + transcripts + disclosed metrics (not narratives)
Deliver a clear Gate verdict: Pass / Borderline / Fail, backed by the strongest evidence
This prompt will scan for:
Revenue structure signals (recurring vs repeat vs one-time, contract length, renewal cycles, vulnerable revenue lines)
Lock-in mechanisms (switching costs, workflow integration, contract clauses, rebid risk, procurement control)
Hard retention proof (churn, cohort behavior, backlog, pricing increases + customer reaction)
Downturn behavior & churn triggers (what happened in past recessions + what would realistically break captivity)
Copy and Insert your stock name:
ROLE
You are a senior equity analyst writing an investment-quality memo for a long-term compounder investor.

COMPANY
[INSERT COMPANY NAME]

OBJECTIVE
Assess how captive this company’s revenue truly is
Core question: “If the company stopped all sales and marketing today, how long would revenue keep coming in at roughly the same level?”

EVIDENCE RULES
Use:

Official company filings, annual reports, and regulatory disclosures

Earnings call transcripts and investor presentations

Competitor filings and disclosures (to benchmark industry norms)

Credible sector research and expert commentary (industry associations, regulators, reputable consultancies, major research providers)

First-principles industry reasoning

Prefer primary sources. Avoid blogs, social media, and unsourced claims.
Cite sources inline: (source, date).
If something is not disclosed, state “not disclosed” instead of guessing.
Clearly distinguish facts vs interpretation.

WRITING STYLE
Write in a MECE memo style (clear buckets, no overlap, high signal).
Be concise and professional. Avoid generic explanations. Use company-specific facts.

ANALYSIS REQUIRED

EXECUTIVE SUMMARY

Captive Revenue Verdict: Pass / Borderline / Fail

3 key evidence points

3 key risks

2–3 realistic churn triggers

One-sentence answer to the core question

REVENUE STRUCTURE

Revenue breakdown (subscription / contract / transactional / project / usage-based)

Recurring vs repeat vs one-time mix

Typical contract length / renewal cycle / purchase frequency

Identify which revenue streams are most vulnerable if selling stops

STRUCTURAL LOCK-IN

How embedded is the product/service in customer workflows?

Switching costs: time, disruption, operational risk

Does lock-in deepen over time with usage/integration?

Are there substitutes that bypass switching costs entirely? (outsourcing, alternative workflow, in-house)

CONTRACTUAL LOCK-IN

Contract terms, renewal clauses, notice periods

Renewal friction: auto-renew vs renegotiation vs rebid

Who controls renewal decisions (users vs procurement vs CFO)?

Does renewal create repricing or tender risk?

PRIORITY LOCK-IN

Mission-critical vs discretionary spend

Budget category (IT, compliance, operations, marketing, etc.)

Evidence of resilience or vulnerability during downturns (if available)

What would realistically cause customers to cut this spend?

CUSTOMER DECISION FREQUENCY

How often do customers actively re-decide to keep paying?

Is this “decide once, pay forever” or “decide every time”?

What triggers reassessment (renewal cycle, budget review, new CIO, platform migration)?

PRICING POWER (AS A CAPTIVITY SIGNAL)

Evidence of price increases and customer reaction

Is pricing power structural or temporary?

Are contracts indexed to inflation or renegotiated manually?

METRIC EVIDENCE

Retention / churn (gross and net if available)

NRR / GRR if disclosed

Cohort behavior, backlog/RPO indicators if relevant

Sales & marketing spend trends

Do not assume high S&M means weak captivity. Distinguish retention-driven vs growth-driven using evidence and management commentary.

SUMMARY TABLE (MANDATORY)
| Captivity Driver | Strength (High/Med/Low) | Evidence (source, date) | What Could Break It |

Drivers must include:

Structural lock-in

Contractual lock-in

Priority lock-in

Decision frequency

Pricing behavior

Metric support

FINAL VERDICT

Rate: Pass / Borderline / Fail

Justify with the 3 strongest evidence points

Identify the biggest weakness

If verdict = Pass, state 2 reasons it is not “exceptional captivity”

FINAL LINE
End with:
Gate 1 Verdict: [Pass/Borderline/Fail] — [One sentence summary]
What to do with the result
Look at the verdict first.
Pass : Move to Gate 2.
Borderline : some stickiness, but gaps. Flag it. Proceed with caution.
Fail :revenue depends on constant selling effort. The bucket leaks. Stop here. No need to run Gate 2 or Gate 3.
Gate 2 : The Compounding Gate
Now that we know whether the revenue is truly captive, the next question is even harder:
Does time make this business stronger ?
Think about GoPro.
In 2014, it looked unstoppable.
The product was iconic. The brand was everywhere. The stock hit $90.
But the business was sitting on a ticking clock.
GoPro made cameras.
And cameras get commoditized.
Every year, smartphones got better.
Chinese competitors got cheaper.
The “cool factor” faded.
GoPro had to keep launching new models just to stay relevant.
By 2018, the stock was under $5.
Because in consumer hardware, time doesn’t build moats.
It destroys them.
This is the gate that separates true compounders from businesses that just look good in a spreadsheet.
What this prompt will uncover:
Define the core engine and test whether it has actually stayed stable or quietly changed
Surface the specific disruption risks that could break the model
Deliver a clear verdict: Stronger / Stable / Weaker
This prompt scans engine stability, moat direction, and economics to see if the business is compounding or breaking
Copy it
Insert your stock name
Run it in Gemini Deep Research
Already included in the Prompt Library (23+ prompts) — free for paid subscribers.