
3 Steps to Avoid the Most Expensive Assumption in Investing
Stop Guessing Growth Rates

Last week I was talking with a friend.
He was walking me through a stock he liked.
Small-cap industrial.
Decent margins.
Clean balance sheet.
He said: “Even if I assume 10% growth, it still works.”
I asked: “Where does the 10% come from?”
He paused, smiled, and said, “That’s what it’s been growing at for last 3 years.”
Growth slows. It always does.
I’ve watched stocks drop 20% on a single earnings call because growth was “only” 10% instead of 15%.
The problem:
To know what growth rate to assume, you need deep understanding of the business model.
That used to take weeks…The good news?
AI is here.
In 30 minutes, it can:
Read 10 years of filings, transcripts, and industry reports
Compare your company against competitors and benchmarks
Extract the real drivers, constraints, and risks behind growth
10x deeper. 10x faster.
Here’s the 3-step AI workflow to understand a stock’s growth :
Map the growth engine : where growth comes from (price, volume, mix).
Identify the constraints :what limits that growth in practice.
Validate the assumption : test your growth view against history, competitors, and industry structure to see what really worked and what didn’t.

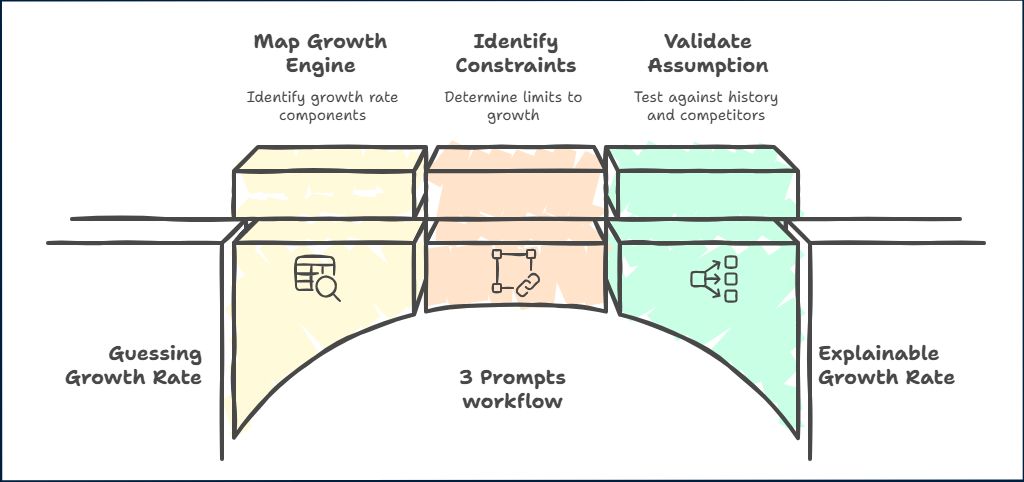
Together, these 3 steps turn growth from a guessed number into something you can actually explain.
Step 1: Map the Growth Engine
A 10% CAGR is not one thing.
It’s made of parts.
Volume. Price. Mix. New markets. Acquisitions.
Some are repeatable. Some are one-off. Some have room to run. Some are already maxed out.
This step answer 1 questions:
Where does growth come from?
To answer it, you need to know:
What are the 2–3 main growth levers?
Which lever did most of the work historically?
What triggers growth at the unit level and how repeatable is it?
What’s signal vs noise? (one-off boosts vs durable drivers)
Here's the prompt to run in Deep Research mode :
TASK :Analyze [Insert stock] and decompose its revenue growth at a deep business level.

ROLE:You are a fundamentals-driven, long-term equity investor.

Your job is to deeply understand how this business has generated revenue growth

and what actually drives that growth at the business-model level.

You think in terms of price vs volume, customer behavior, geography, mix,

and industry structure — not narratives.

You are skeptical by default.

SOURCES
Use ONLY the provided sources:

– Annual reports / 10-K / 20-F

– Earnings call transcripts

– Investor presentations

– Industry reports

– Competitor filings

If a claim cannot be clearly supported, explicitly write:

“Not supported by sources.”

PURPOSE

The purpose of this analysis is to explain, clearly and factually, where revenue growth has actually come from

and which parts are structural vs temporary.

This analysis will be used to set realistic future growth assumptions.

OUTPUT

 EXECUTIVE SUMMARY

In 6–10 bullet points, answer clearly:

– Has revenue growth been driven mainly by **volume, price, or both**?

– Roughly what % of growth came from:

  • volume

  • price / pricing actions

  • mix

  • acquisitions

– Within volume growth, what mattered most:

  • new customers

  • higher usage / frequency

  • geographic expansion

– Which growth sources look structural vs temporary?

– How does this growth compare to key competitors and industry trends?

Be explicit. Avoid vague language.

1. Revenue growth equation

Express revenue growth using a clear equation.

Example:

Revenue growth = volume growth × price/mix × acquisitions

Explain each term in plain English.

2. Volume growth breakdown

If volume contributed to growth, explain clearly:

– What volume actually means in this business

  (customers, transactions, units sold, subscribers, usage, AUM, etc.)

– Where volume growth came from:

  • new customers

  • increased usage per customer

  • new geographies

  • new products / services

– Which source mattered most, and why

Cite sources.

3. Price and mix contribution

Explain clearly:

– Whether pricing increased in real terms or only offset inflation

– Whether price increases were:

  • contractual

  • discretionary

  • mix-driven

– Evidence of pricing power vs necessity

Cite sources.

4. Acquisition vs organic growth

Explicitly separate:

– Organic growth

– Growth from acquisitions

Explain how much acquisitions contributed and whether they masked slower organic growth.

5. Industry and competitor context

Explain:

– How industry growth evolved over the same period

– Whether [COMPANY] grew faster/slower than peers

– Whether growth came from market expansion or share gains

Use competitor filings or industry data if available.

6. What management *says* vs what the data shows

Explicitly contrast:

– Management’s growth narrative

– What the numbers actually imply

Flag any inconsistencies or overly optimistic framing.

7. Structural vs temporary growth

Classify each growth source as:

– Structural (likely repeatable)

– Temporary (cycle, post-COVID, pricing reset, one-offs, M&A-driven)

Justify each classification with evidence.

8. Critical skepticism check

Answer explicitly:

– What must remain true for these growth drivers to persist?

– Which growth source is most fragile?

– What is most likely to disappoint investors who extrapolate past growth?

RULES

– Do NOT use valuation language

– Do NOT rely on management guidance alone

– Be factual, explicit, and source-based

– If data is missing, say so clearly
After running this prompt, you get a clear, structured breakdown of where growth actually came from
This gives you the growth engine, not a story.
Once that’s clear, you’re ready for Step 2: finding what limits that growth in practice.
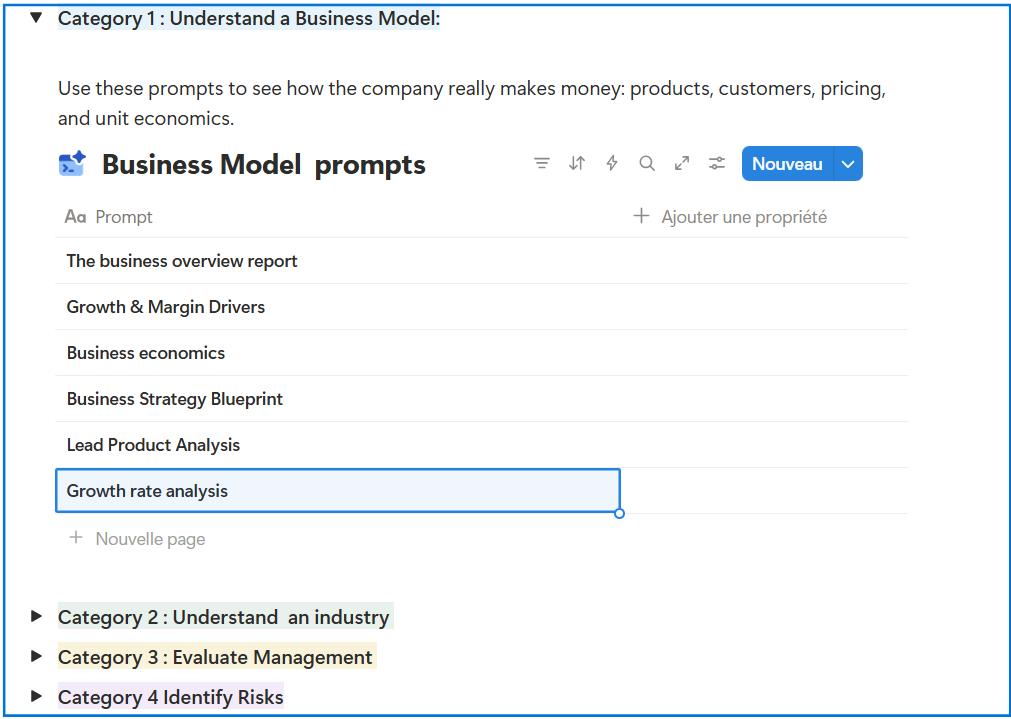
Note: I’ve added this prompt to the Prompt Library, so you can copy-paste it anytime and use it as your default starting point when doing a growth rate assumption.
Step 2: Identify Growth Constraints
Every growth lever has a ceiling.
Volume saturates.
Pricing hits resistance.
New markets stall.
This step answers one question:
What limits each growth driver?
In business operations, growth is limited only by one main bottleneck at a time.
Not 10.
Not everywhere.
only 1.
Fix that constraint, and growth comes back.
Until the next limit shows up.
So I’m asking 2 simples questions:
what’s the one bottleneck holding the business to grow more now ?
and if this blocker is removed, what becomes the next bottleneck ?
This idea comes from the Theory of Constraints, made popular by The Goal, a business book written as a nice story.
To apply this:
Go to Gemini Deep Research
Upload the PDF from Step 1
Run the prompt below