
5 Steps to Become a Better Investor With AI (Faster)
Use AI as your personal investing coach

Hello, Fellow Stock Pickers
A few days ago, an investor friend asked on X:
“What will you do to become a better investor?”
The replies were smart.
Read more. Journal. Track mistakes.
But nobody mentioned the biggest lever we have today: AI.
I’ve been testing it myself.
And it feels… nostalgic.
Like those early days, staying up late with Buffett and Munger.
Back then, they fueled my learning.
Today, AI can do the same whether you’re just starting or years in.
Learning in investing never ends.
And in 2025, AI is the smartest way to keep going.
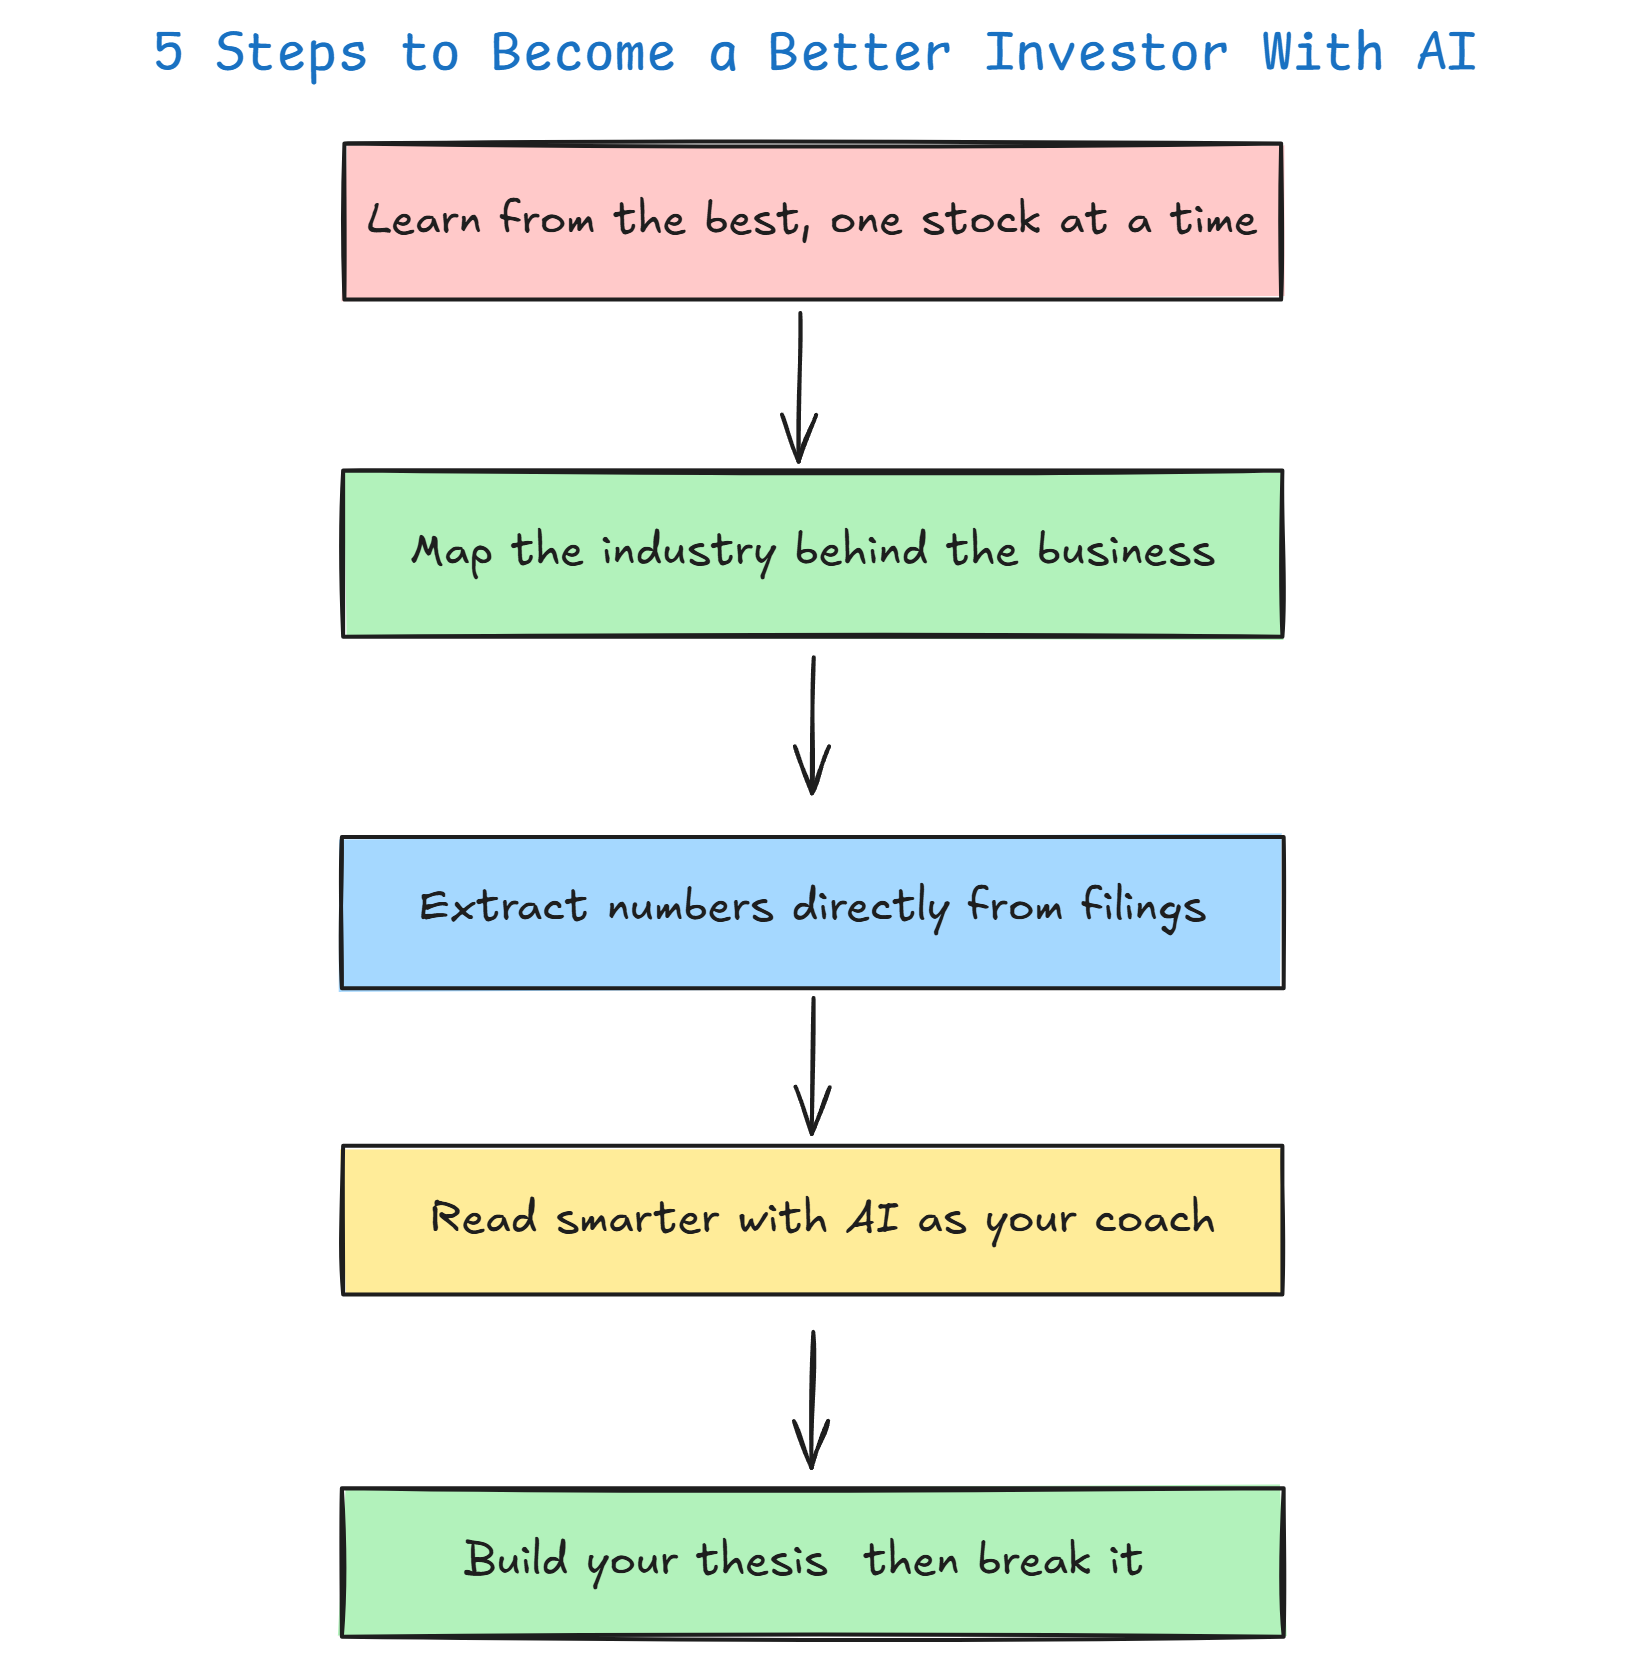
Here’s my 5 step process to become a better investor:
Step 1 : Learn from the best, one stock at a time
Want to learn fast?
Don’t reinvent the wheel. Start with investors who’ve proven it for decades.
What to look for:
A real track record (not a lucky 2-year bull run)
Long-term bets, not macro guesses
Concentrated portfolios, where conviction is visible
Aligned with your philosophy
Then: pick ONE stock from their portfolio.
Not five. Not ten. One.
One stock = one deep dive.
You’ll progress far faster than chasing a dozen half-baked ideas.
Time-box it: one sprint. One week. One idea.
Example:
I like Alluvial Capital. In their latest letter, they share their top positions
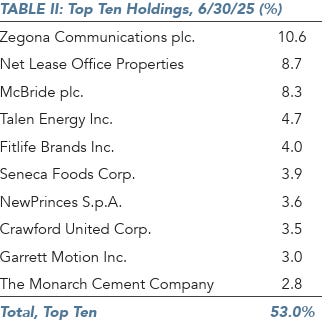
Sometimes managers share their theses, sometimes they don’t.
If there’s nothing concrete, it’s worth a quick scan before choosing.
That’s where AI comes in.
Run a quick DeepSearch in Gemini to get a first macro understanding of each stock so you know which one is worth the deep dive.
ROLE
You are my equity research assistant. I will give you a list of tickers.
Return: (A) a strict numbers table for fast comparison, and (B) a one-sentence mini-pitch per stock for business-model context.

INPUT
[PASTE TICKERS HERE]

OUTPUT SPEC

A) TABLE — MARKDOWN, headers EXACTLY:
Ticker | Sector | ROE % (period) | Margin % (metric) | Growth 5y % (basis) | EV/EBIT | EV/Sales | Quick Score (0–5) | As-of

• ROE % (period): Prefer 5–10y avg; else 3y; else latest. Indicate period used (e.g., “5y avg”).
• Margin % (metric): Prefer EBIT margin 5y avg; else net margin 5y avg; else LTM. Indicate metric (e.g., “EBIT 5y avg”).
• Growth 5y % (basis): Prefer consensus revenue CAGR next 5y; else management long-term guide; else best available. Indicate basis (“consensus” / “guide”).
• EV/EBIT, EV/Sales: Use latest LTM or most recent FY; keep consistent across all rows if possible.
• Rounding: percentages and multiples to 1 decimal (e.g., 17.4%, 12.1x).
• Missing data: write “n/a” (never guess).

Quick Score (heuristic, do not explain in table):
Start at 0, then +1 each if: ROE ≥ 15%; EBIT margin ≥ 15% (or rising trend); Growth 5y ≥ 8%; EV/EBIT ≤ 15x; margins stable/improving over 5y. Cap at 5.

B) MINI-PITCHES — one bullet per ticker, max 30 words, EXACT TEMPLATE:
• [Ticker]: Sells [core product/service] to [main customer]. Revenue is [recurring / semi-recurring / transactional / cyclical]. Margins [high/med/low], asset [light/heavy]. Moat hint: [brand / network / switching costs / cost / regulation / none].

C) SOURCES & DATES — after pitches:
• “As-of” month/year for valuation & margins.
• List key sources used (company filings, investor deck, consensus source if any). Keep to 1–3 bullets.

CONSTRAINTS
• Be concise, standardized, and comparable across tickers.
• Do NOT output explanations, caveats, or methodology text outside the required sections.
• If periods/metrics differ across names, make that clear in the table labels (the parentheses fields).
• No narrative outside the mini-pitches. No recommendations.

FORMAT STRICTLY
1) Table
2) “Mini-pitches”
3) “Sources & dates”
You’ll get a clear scan in minutes.
Pick one. Dive in.
It doesn’t need to be perfect.
The goal isn’t finding the stock.
It’s learning a new business.
Step 2: Map the industry behind the business
Once you’ve picked a stock, zoom out. Every company lives inside a system.
What matters isn’t just “what they sell,” but:
Who they sell to
Who really has pricing power
Where the biggest risks and bottlenecks hide
Here’s where AI shines. Instead of 100 reports, one prompt can give you a map of players, value chain, and key shifts.
I wrote a full letter on the framework ( “ How to Understand Any Industry with AI “) where I share 3 prompts to shortcut this step.
Several investors told me it changed how they dig into companies.
That’s the foundation. From there, the numbers make sense.
Step 3: Extract numbers directly from filings
Most investors tackle annual reports the painful way:
Hundreds of pages. Jargon. Numbers buried in footnotes.
The result?
Skimming makes you miss details.
Copy-pasting into excel wastes hours.
And if you ask ChatGPT or Gemini, they’ll bluff because they aren’t tied to the document.
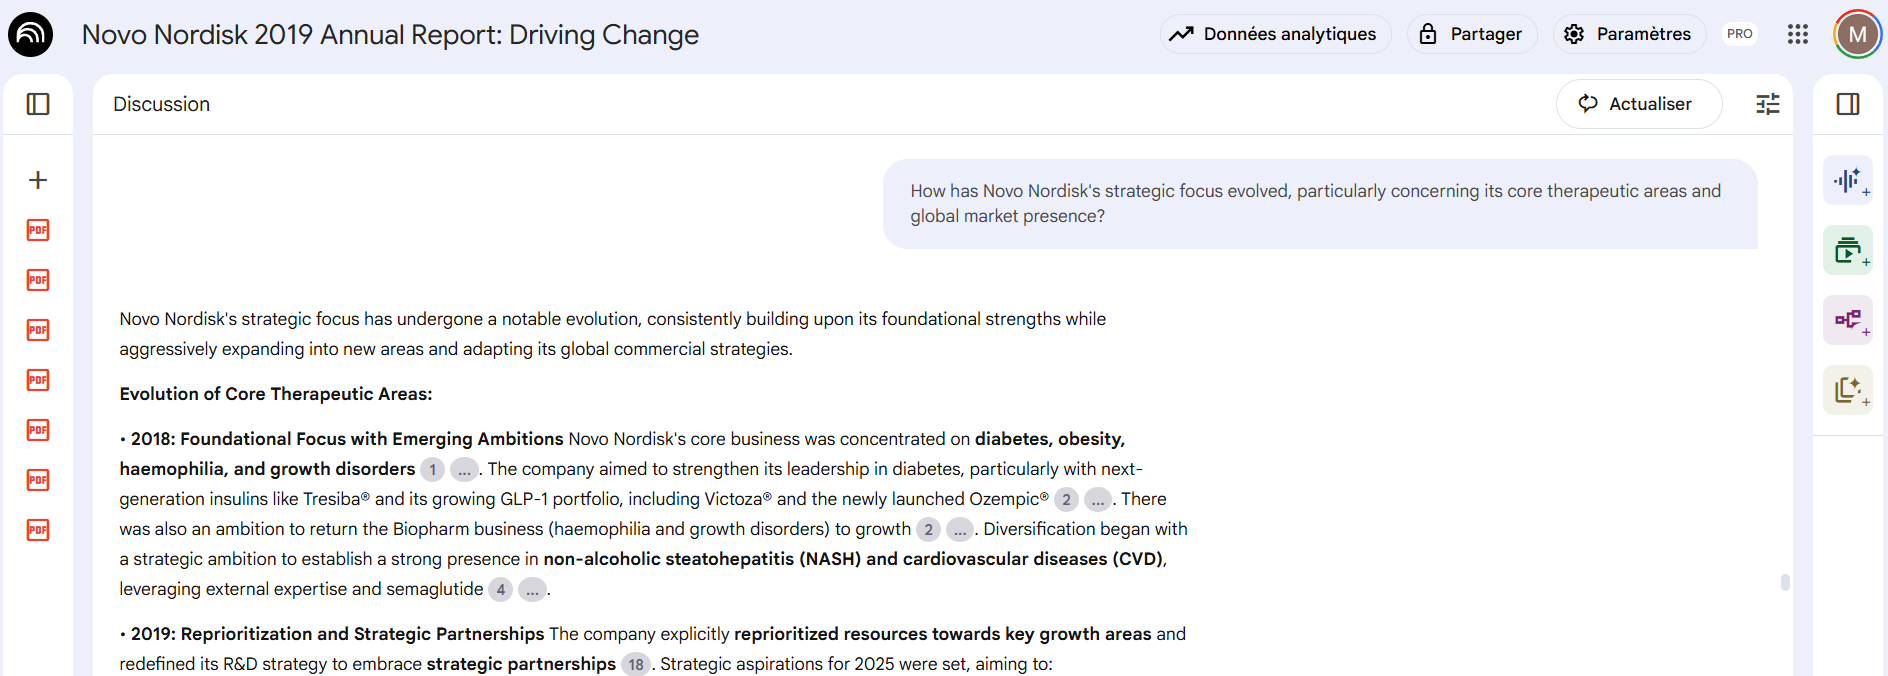
That’s why I use NotebookLM.
You upload the filings 10-Ks, annual reports, investor letters…
It only answers from those sources.
In seconds, you can:
Pull clean tables of revenue, margins, and cash flow
Fact-check trends across 10 years without a single misquote
Ask strategic questions straight from the report
Here’s the exact prompt I use. Steal it, adapt it, make it yours:
ROLE
You are a financial analyst.
From the attached annual reports (7–10 years, one company), extract historical financials into a table, then fact-check your own work to avoid copy/paste or calculation mistakes.

TASKS
Extract these metrics (group totals):
- Revenue
- EBITDA (use reported; if not reported, compute = EBIT + D&A and label "computed")
- Depreciation & Amortization (D&A)
- EBIT (Operating Income)
- Net Income

Calculate:
- YoY Growth % for Revenue, EBITDA, EBIT, Net Income
- Margins %: EBITDA/Revenue, EBIT/Revenue, Net Income/Revenue

Formatting rules:
- Auto-scale numbers
- State unit once at the top: “Figures in [currency] [millions/billions]”
- Round % to 1 decimal
- Use “—” if missing

OUTPUT — STRICT ORDER
Part A — TABLE (Markdown; years as columns)
Rows in this order:
Revenue | Revenue Growth % | EBITDA | EBITDA Growth % | EBITDA Margin % |
D&A | EBIT | EBIT Growth % | EBIT Margin % |
Net Income | Net Income Growth % | Net Margin %

Part B — FACT CHECK
Recompute growth % and margins directly from extracted numbers.
If difference >0.1pp or 0.1 unit, flag with ✗ and corrected value.
If consistent, mark ✓.
The output?
A clean, fact-checked table of years of financials.
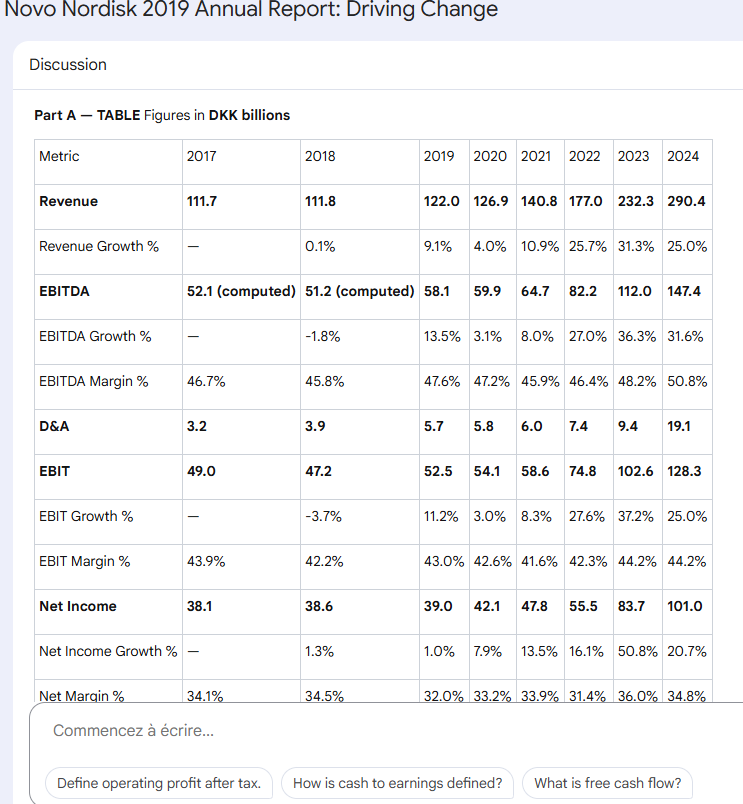
For me, this step is a game-changer.
Because unlike ChatGPT, NotebookLM won’t “sound smart” it only shows what’s in the filings.
This is your foundation. Numbers you can trust, in the format you want, in seconds.
But numbers alone don’t teach you how a business works.
That’s what Step 4 is for.
Step 4: Read smarter with AI as your coach
Here’s the truth: you can’t skip annual reports.
Every serious investor reads them. That’s where the real story lives.
But here’s the good news:
AI makes this grind 10x easier if you use it the right way.
How I use AI while reading an annual report :
When a paragraph doesn’t click
Paste it into ChatGPT thinking model. Add context. Get it explained step by step.Go back and forth
Ask: “Margins fell in 2023 what could explain it?”Expand while you read
When the report mentioned “supply chain pressures,” pause
Prompt: “Give me a 5-point explainer on supply chains in pharma manufacturing.”
Now you had industry context, not just company jargon.Keep the hard part human
AI is the coach. But you’re the one lifting the weights.
Reading is still required that’s where the deep conviction comes from.
That’s why this step matters.
Numbers give you a snapshot.
Reports teach you how the business really works.
Next, we’ll take it up a level and use AI not just to explain, but to challenge your assumptions.
Step 5:Build your thesis, then break it
After all this work, you should be able to write a one-page thesis.
Short, sharp, IRR math included.
Example (Novo Nordisk):
Business: Global leader in diabetes & obesity (Ozempic, Wegovy). Obesity = trillion-$ market. Novo controls brand, supply, and pipeline (oral GLP-1, combos).
Growth levers: ~15% revenue CAGR 2024–2029, margin expansion from scale, strong pipeline extending moat.
Risks: Competition (Eli Lilly), pricing/regulation, patents. But TAM is massive and pipeline continuity = limited impact.
IRR math: FCF yield 7% + 14% growth ≈ 21% return at today’s multiple.
That’s the baseline.
But here’s the key: don’t stop here.
Now turn AI against yourself.
Feed your thesis back in and tell it to rip it apart.
Here’s a simple prompt you can use:
“Act as a bear-case analyst. Given my long-term investment thesis: [PASTE THESIS], identify its weakest assumptions, hidden risks, and failure points. Be ruthless, precise, and concise. No generic risks. Only sharp challenges that could break the thesis.”That’s just the starting point.
You go back and forth with AI tightening arguments, rebuilding stronger.
And if you want the full playbook, I wrote a separate letter with the exact prompts for a complete bear-case teardown…
This is how you level up.
AI isn’t just your coach to learn faster.
It’s also your critic to keep you honest.
Recap: The 5 Steps to Sharpen Your Investing
Learn from the best, one stock at a time
Map the industry behind the business
Extract numbers directly from filings
Read smarter with AI as your coach
Build your thesis then break it
Do this cycle for one year.
One stock → one sprint → one thesis at a time.
You won’t just pick better investments.
You’ll become the kind of investor who keeps leveling up.
If you found this useful, share it with another investor who’s serious about leveling up. And if you want more prompts like these, you can get them in my weekly letter
Amazing