
Does Growth Improve Your Stock?
A 3-step AI test

Most investors obsess over revenue growth.
They celebrate 10% growth.
They get excited at 15%.
But revenue growth doesn’t drive long-term returns.
Earnings growth does.
That’s the compounding engine.
2 companies can post the same top-line growth and still produce different outcomes.
Company A grows revenue 15%. Earnings grow 15%.
Company B grows revenue 15%. Earnings grow 25%.
Same growth rate. Completely different outcomes.
The difference is :
Company A grew by adding people.
More revenue yes but also more costs, and more complexity.
Margins stayed flat.
Company B grew on what it already built with the same cost base.
The difference has a name: operating leverage.
and the same mechanism explains why some stocks collapse 50% in a single year.
When growth slows, fixed costs remain.
Margins compress and earnings fall faster than anyone expects…
So understanding operating leverage isn’t optional.
The good news is that AI can help to do that faster and deeper.
That’s exactly why you’re reading this.
Used correctly, this AI workflow lets you:
Surface operating leverage patterns across years of data
Connect margin behavior to real business drivers
Stress-test what happens when growth slows
Do in minutes what used to take hours
Let’s dive in.
What Operating Leverage Actually Means
Operating leverage is simple:
Does this business get better as it grows?
Imagine 2 businesses.
Both start at $10M revenue. Both make $1M profit.
On the surface, identical.
But they’re built differently.
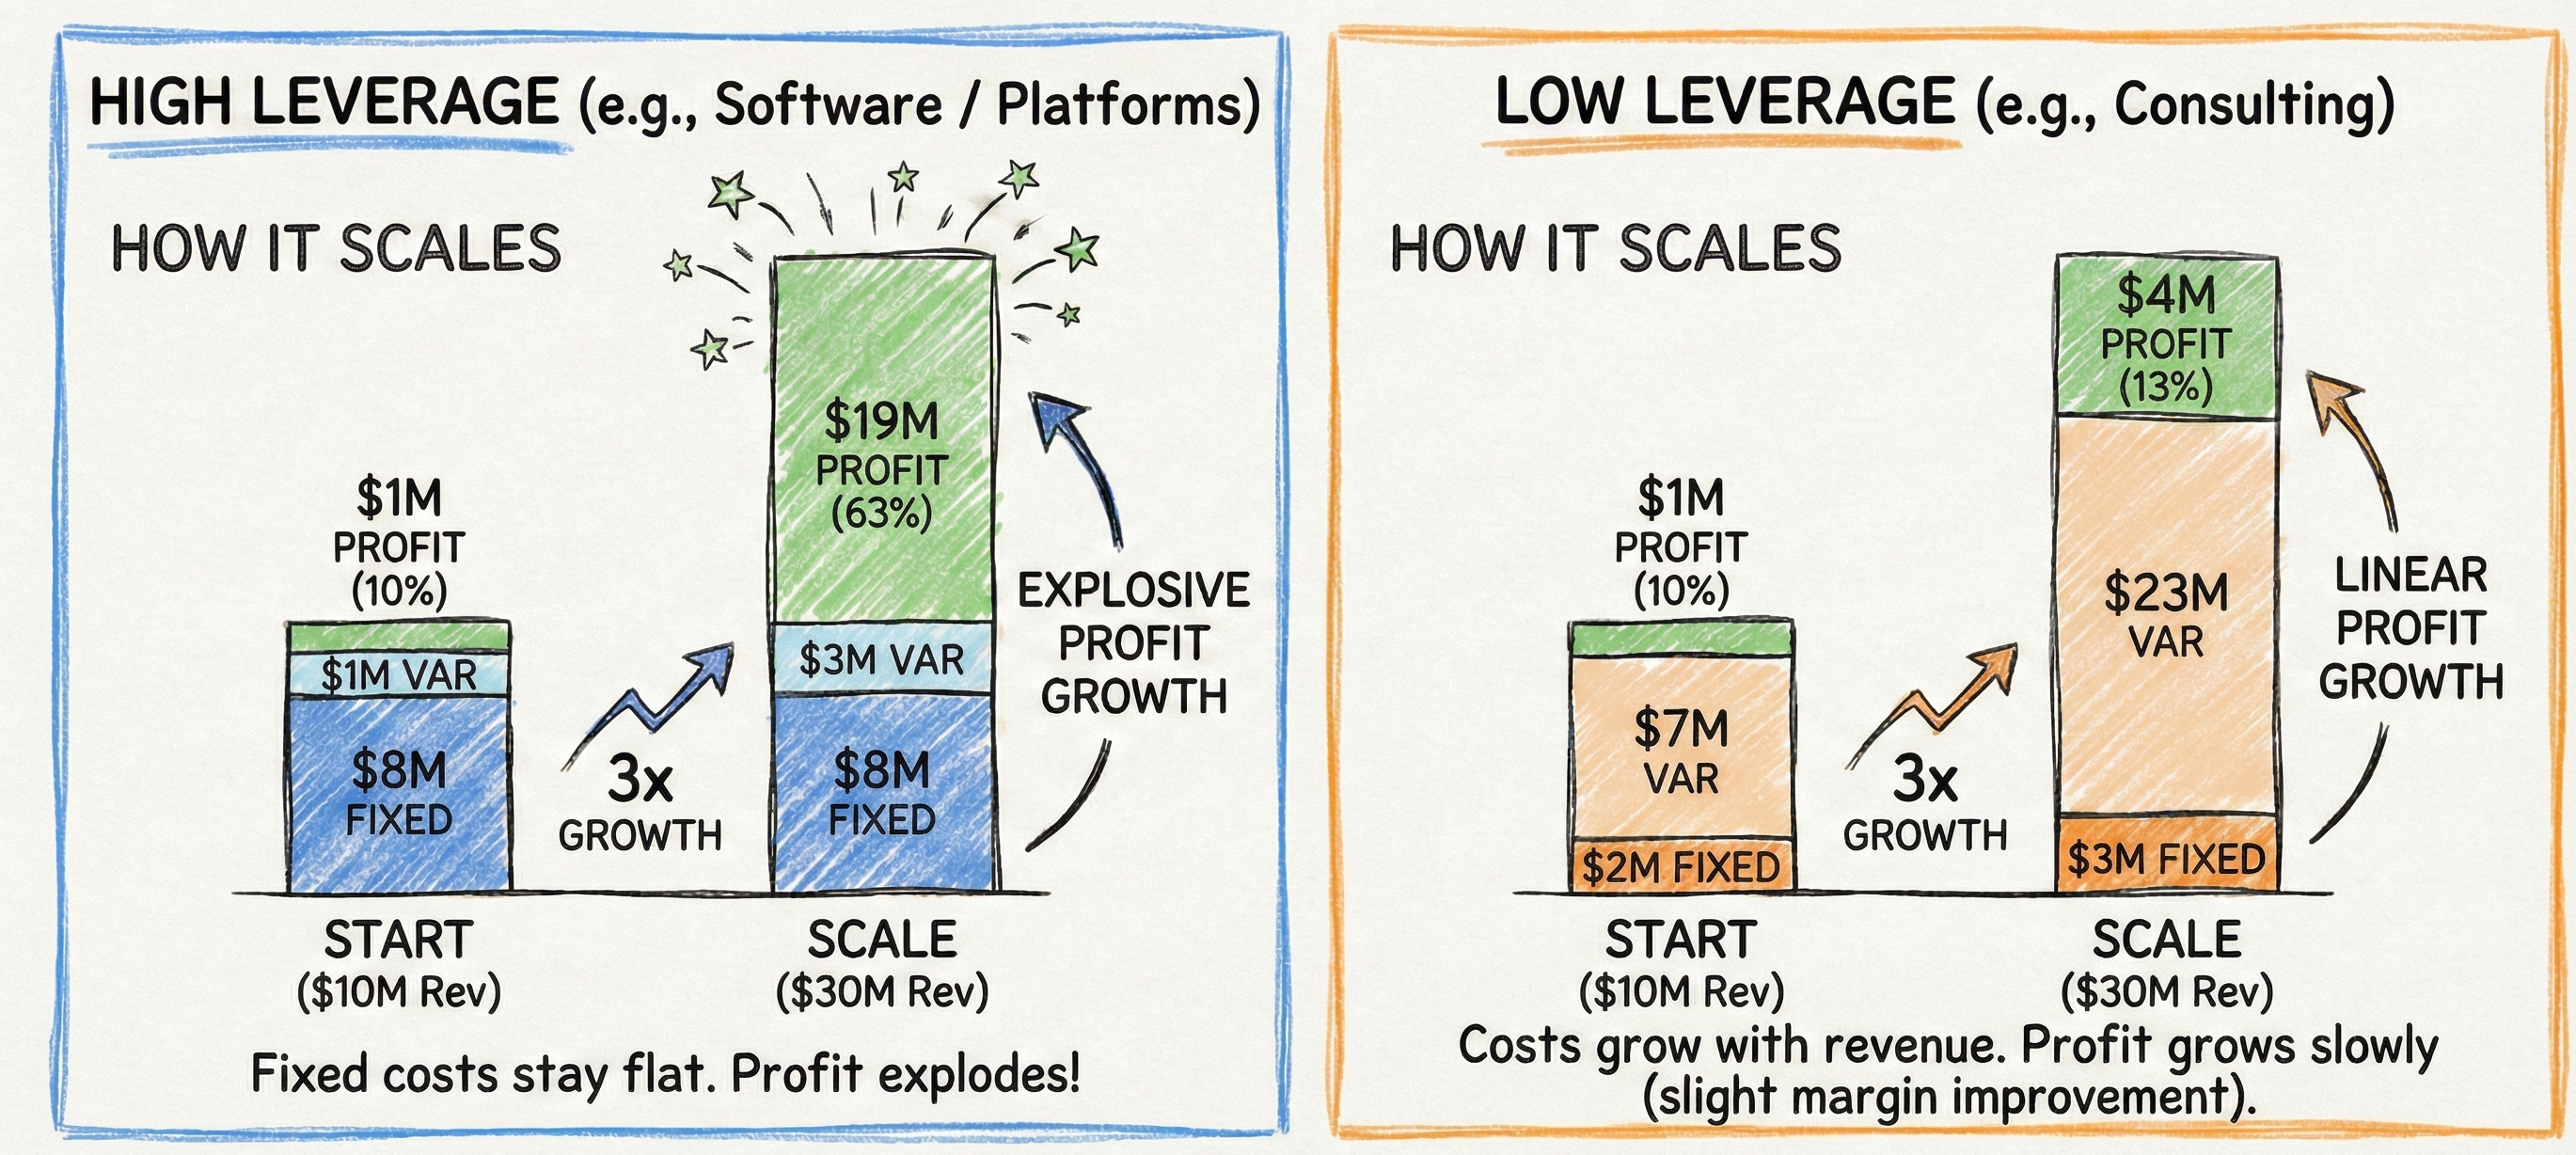
Business A: High Operating Leverage
The product is already built.
The platform exists. The infrastructure is paid for.
Revenue grows from $10M to $30M.
Costs barely move.
Profit jumps from $1M to $19M.
Revenue: 3×. Profit: 19×.
Business B: Low Operating Leverage
Every new client requires more people. More people means more costs.
Revenue grows from $10M to $30M. Profit rises from $1M to $4M.
Revenue: 3×. Profit: 4×.
Both companies are “growing.”
Only one becomes more valuable per dollar of revenue.
The Scale Test:
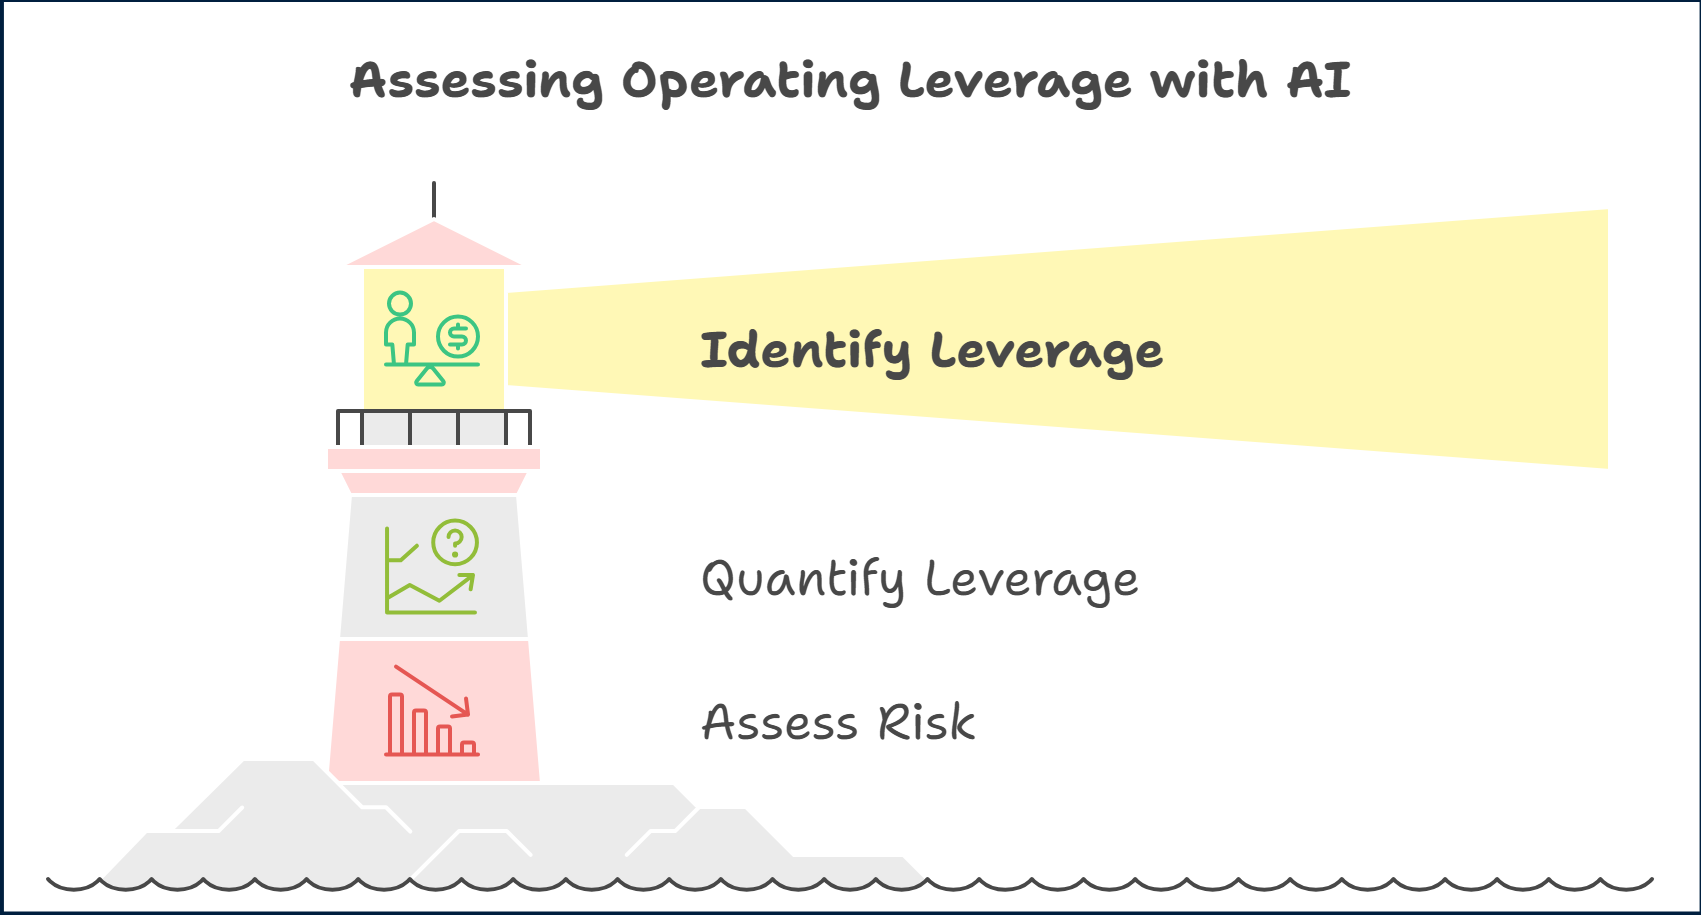
I built a 3-step AI workflow to answer one question:
“Does this business get better as it grows or just bigger?”
Does leverage exist and why?
How strong is it?
What happens when growth slows?
Step 1: The Cost Structure Test
Question: Does this business have structural operating leverage?
Some businesses scale by hiring or adding more assets.
Revenue up → costs up → margins flat.
Others scale on what’s built.
Revenue up → costs stable → margins expand.
some signals:
Fixed costs paid
Revenue grows faster than headcount
Built-in distribution
This step answers: “If this business doubles, what percentage of costs stay fixed?”
How to run it:
Open Gemini or other LLM in Deep Research mode
Paste the prompt below
Replace [COMPANY NAME]
Run
Copy-Paste Prompt:
ROLE
You are an experienced long-term investor focused on business quality and operating leverage.
YOUR JOB
Assess whether [INSERT COMPANY NAME] has structural operating leverage based on its cost structure and scaling mechanics.
OBJECTIVE
Conduct a Cost Structure Test covering at least the last 5–10 years.
Determine whether operating leverage is structural or temporary, and how it compares to industry norms.
EVIDENCE RULES
Use only reliable sources:
French filings:
URD (Document d’enregistrement universel) / Annual report
Semi-annual financial report
Earnings releases + investor presentations
Earnings call transcripts (if available)
Competitor filings for industry comparison (Fnac Darty, peers, etc.)
Mark any non-factual analysis clearly as (inferred)
No blogs, no opinions, no unsupported claims.
REPORT STRUCTURE
I. EXECUTIVE SUMMARY (max 5 bullets)
Operating margin level and 5-year trend
Primary cost structure: fixed-heavy or variable-heavy?
Industry comparison: above, at, or below peers?
Classification: Structural Leverage / Partial Leverage / Labor-Based Growth
The one-sentence verdict
II. THE COST STRUCTURE ANATOMY
A. Fixed vs Variable Split
Major fixed costs (R&D, platform, brand, infrastructure, leases, overhead)
Major variable costs (COGS, fulfillment, commissions, support)
Estimate: % of total costs fixed vs variable
Comparison to competitors
B. The "Already Paid For" Test
What has already been built that future customers get almost for free?
Quantify if possible: investments, years of build
Examples: platform, logistics network, brand, store network, automation
C. Marginal Cost Reality
Cost to serve one additional customer/order
Does marginal cost decline, stay flat, or rise with scale?
Where does it structurally bottom out?
D. Margin Bridge (Gross Margin vs OPEX Leverage)
Purpose: avoid confusing temporary margin effects with true operating leverage.
Table:
Year | Gross Margin % | SG&A % of revenue | EBIT %
Decompose EBIT changes:
How much comes from gross margin expansion?
How much comes from SG&A leverage?
Identify:
Temporary drivers (pricing cycle, promotions, supply shortages, mix effects)
Structural drivers (automation, scale efficiencies, cost discipline)
Mark uncertain conclusions as (inferred).
III. THE SCALING MECHANICS
A. The "Double the Business" Question
If revenue doubled tomorrow:
What would need to scale (people, warehouses, IT, complexity)?
What would stay largely fixed?
Estimate: what % of costs would double vs remain fixed?
B. Revenue Per Employee
Table: Year | Revenue | Employees | Revenue per employee
5-year trend: rising, flat, declining?
Compare with 2–3 competitors
C. Operating Expense Behavior
Table: Year | Revenue | SG&A | SG&A %
Is SG&A growing slower than revenue (leverage) or faster (anti-leverage)?
D. Cycle Stress Test (Structural vs Temporary Leverage)
Purpose: test whether leverage holds in bad years.
Identify strong demand years vs weak demand years
Compare across cycles:
Revenue growth
EBIT margin
SG&A behavior
Key question:
Does margin structure hold when demand weakens, or does profitability collapse?
If leverage disappears in downturns → likely temporary, not structural.
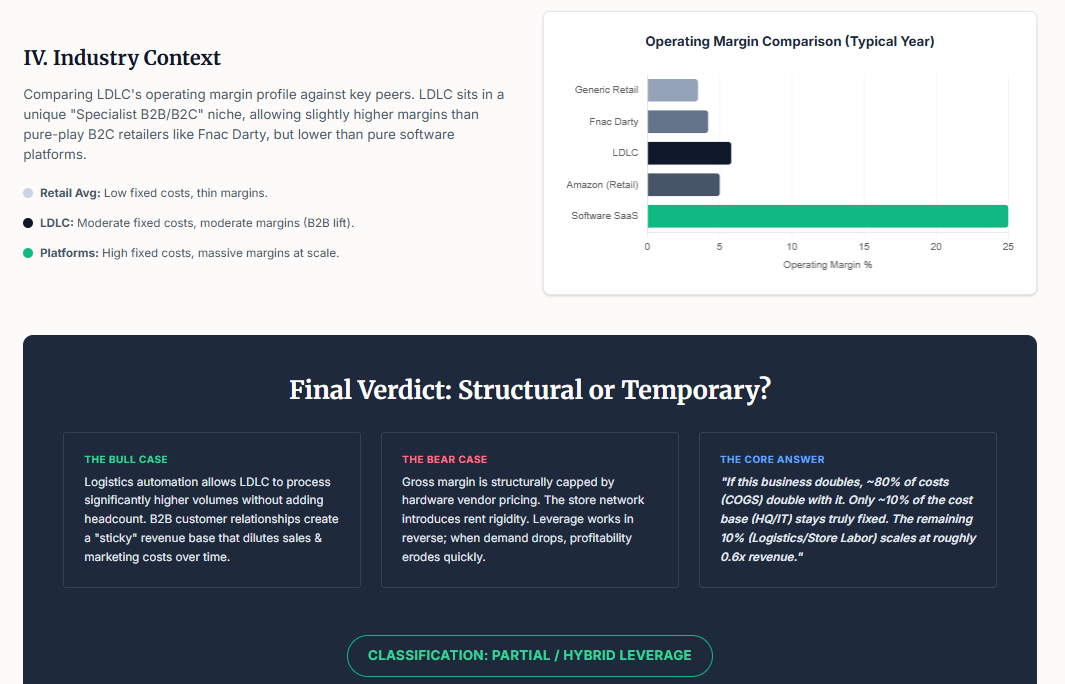
IV. INDUSTRY CONTEXT
A. Industry Operating Margin Range
Typical operating margin range for this industry
Where LDLC sits: bottom / middle / top quartile
B. Industry Cost Structure Norms
Is this industry structurally fixed-cost heavy or variable-heavy?
Is LDLC structurally different from peers?
C. Best-in-Class Comparison
Which player shows the strongest operating leverage?
What is structurally different in their model?
FINAL VERDICT
Cost Structure Score (1–10):
How fixed-cost heavy is the model?
Scaling Score (1–10):
How well does revenue scale without proportional cost increases?
Industry Position:
Above average / Average / Below average operating leverage vs peers
Classification:
Structural Leverage
Partial Leverage
Labor-Based Growth
The Core Answer:
"If this business doubles, what percentage of costs stay fixed?"
Give a specific estimate and justify it with evidence.
What the Results Tell You:
The numbers matter less than the reasoning.
Anyone can see margins expanded. The question is: do you understand WHY?
After running Step 1, you should be able to explain:
What’s fixed in this business?
What scales with revenue?
Why this structure is different from competitors?
If you can’t explain it simply, you don’t understand it yet.
Step 2: The Incremental Margin Test
Answer one question:
For every $100 of new revenue, how much becomes profit?
That’s incremental margin.
Higher than current margin → leverage
Same → no leverage
Lower → business degrades as it grows:
This is the dangerous case.
Some businesses get worse as they grow.Why it happens:
New customers cost more to acquire (CAC rises)
More discounts needed to sustain growth
Complexity and overhead explode
Expansion moves into weaker markets
Run This prompt to have you answer ( Always in Deep research mode)
Copy-Paste Prompt: