Hello, Fellow Stock Pickers
Everyone knows Buffett’s advice:
Only invest in businesses inside your circle of competence.
It’s a rule you can’t break.
Step outside it, and you risk big losses.
But there’s another danger: if you never expand the circle, your future opportunities stay small.
The smart move?
Keep investing only inside your circle and work in parallel to expand it.
I think every investor should dedicate time only to expanding their circle of competence.
No stock picking.
No rushing to buy.
Just learning.
But learning takes time…
The good news is that AI can compress the work. What once took weeks can now be done in hours.
In this newsletter, I’ll show you how to expand your circle of competence with only 60 minutes a week.
Here are the exact 5 steps to do it…
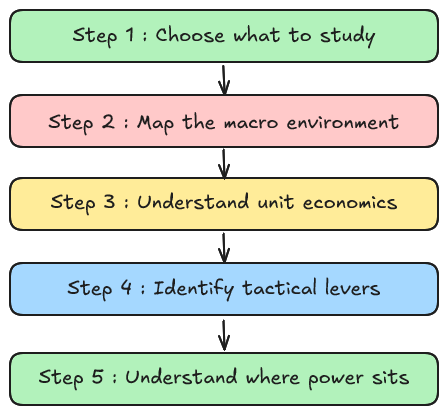
Step 1 : Choose what to study
Don’t try to “learn tech.” That’s too broad.
Take a pause, make a plan.
Split the sector into simple chunks, then pick just one to focus on this week.
How to start:
Look for “good fishing spots” :industries with historically strong, durable ROIC (Michael Mauboussin’s work is a great starting point).
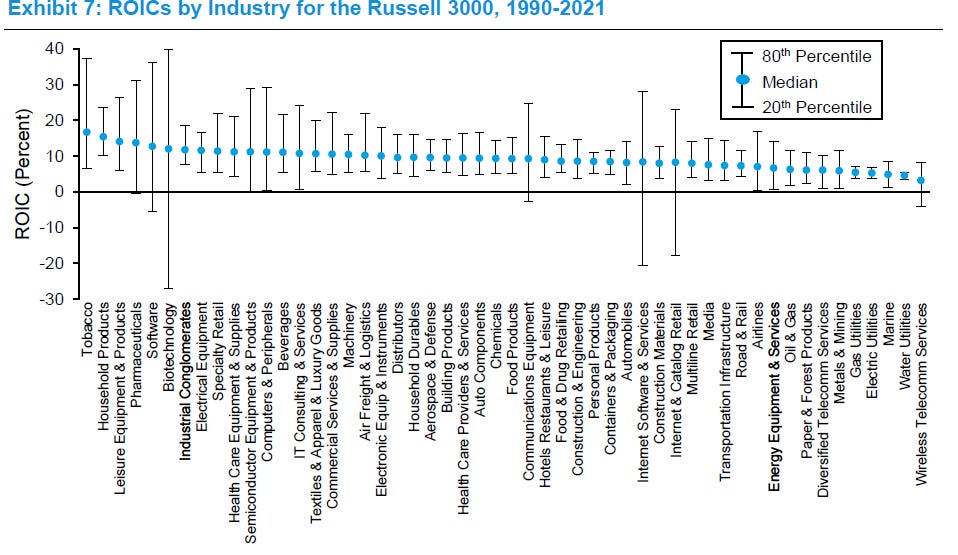
But those categories are still vague. You need a clear breakdown before you can study.
Drop the prompt below into ChatGPT thinking model with any sector (example: IT Consulting & Services).
Review the buckets, then pick one as your focus for this week’s 60 minutes.
Copy this prompt Replace IT Consulting & Services with the sector you want to study:
ROLE: Sector expert analyst.
GOAL: I know nothing about “IT Consulting & Services.” Create a simple, practitioner-grade 4-bucket taxonomy (you choose the names) that covers the sector without overlap.
OUTPUT :
one block per bucket (bullet style):
- Name
- What it sells (1–2 lines)
- How it differs (1–2 line)
- What’s the business (how firms make money; typical work pattern/deal shapes in plain language)
- Why it’s its own category (1–2 lines; clear boundary vs the others)
- Players (2–3 PUBLIC examples with tickers; ≥1 US and ≥1 Europe)
RULES:
- Be MECE; no overlaps. No fluff.
- Practitioner-friendly buckets; avoid jargon (define acronyms on first use).
Choose just one to start.
For example: in IT Consulting & Services, I’d focus on Advisory & Enterprise Transformation for the moment.
Don’t overthink this step. The real research comes next.
Your only goal here is to set a clear, narrow focus for this week’s 60 minutes.
Step 2 : Map the macro environment
You’ve chosen your sub-sector.
Now it’s time to zoom out and build a map of the industry as a whole.
Here’s what I like to check :
Market & structure : How big is the market? How fast is it growing over the next 3–5 years? Is it fragmented (many small players) or consolidated (few giants)?
Value chain & margin pools : Who sells to whom, and where are the stable profit pools?
Regulation & mega trends : What external forces shape demand? Think technology shifts, demographics, ESG, subsidies, tariffs.
Cyclicality drivers :Which cycles really matter here? Commodity prices, consumer demand, capex, credit. (Yes , everything is cyclical at the end of the day, the only question is how violently the cycle swings.)
Here’s a prompt you can use.
Just replace Consulting Advisory with your own sub-sector.
Make it yours.
This prompt is an asset , save it, re-use it, and build your own library of analysis tools.
ROLE: Senior industry analyst.
CONTEXT: I know nothing about IT Consulting & Services- Advisory & Enterprise Transformation .
Build a deep Industry Map that gives an investor a 360° understanding.
TASKS:
Market & Structure
Market size (global + regional), CAGR (last 5y + next 5y).
Fragmentation vs consolidation
Regional split (US, EU, Asia, Rest).
Key demand drivers by segment.
Value Chain & Margin Pools
End-to-end map: Inputs : OEM/Assemblers → Distributors/Channels → End Customers...
Where profits structurally sit and why (EBIT margin / ROCE).
Typical transaction/contract models (spot, contract, subscription).
Regulation & Megatrends
Key current regulations and upcoming changes.
Major megatrends (tech, demographics, ESG, geopolitics, subsidies/tariffs).
Direct link to demand, costs, or margins.
Cyclicality & Growth Drivers
Which cycles matter most (commodity, demand, capex, credit).
Evidence from past downturns.
Growth decomposition: Price vs Volume vs Mix.
Typical pricing model (spot, contract, subscription).
Players & Benchmarks
5–7 representative public companies (≥1 US, ≥1 EU, ≥1 Asia): name, ticker, segment.
Benchmark table: Gross margin, EBIT margin, ROCE, FCF conversion.
Key unit metrics (e.g., ARPU, utilization, churn).
Risks & Scenarios
Top 5 risks (Risk | Likelihood | Impact | Early Signal).
3-year Bull / Base / Bear scenarios: drivers, revenue impact, margin impact, winners/losers.
Strategic Implications
Which layers of the value chain are structurally attractive vs unattractive.
Where disruption is most likely to enter.
Which players are best positioned under each scenario.
OUTPUT FORMAT:
Use bullets for clarity + tables where possible:
Segments Overview → Segment | Size/Share | Growth driver | EBIT%
Margin Pools → Value chain layer | EBIT% | ROCE | Why value accrues
Regional Split → Region | Share | Growth driver | Constraint
Benchmarks → Company (Ticker) | EBIT% | ROCE | FCF/EBITDA | Key metric
Risks → Risk | Likelihood | Impact | Early Signal
Scenarios → Driver | Bull | Base | Bear | Winners | Losers
END WITH (Fast Tests):
Where is the money, and who captures it?
If demand falls 10% for 2 quarters, which layer gets hit first? Why?
What must stay true for margins to be higher in 3 years?
Where is the most realistic disruption wedge?
The output is your industry playbook.
It gives you the full picture of the sub-sector’s environment.
I’ve spent years studying this sector and made good returns investing in its stocks.
What DeepSearch gives you here is close to the clarity you get after being in the industry for years.
Step 3 : Understand unit economics
Once you’ve mapped the environment, zoom in on the operating engine.
This is where you see how businesses in your sub-sector actually make (or lose) money.
Here’s what I check:
Cost structure : Fixed vs. variable costs, utilization, bottlenecks.
Unit economics :
Gross margin : pricing power.
EBIT margin : operating leverage.
Cash conversion (FCF/EBITDA) : ability to turn profit into cash.
ROCE :return on invested capital.
Working capital & capex : How much cash is tied up (DSO, DPO, inventory)? What % of sales must be reinvested to stay in business vs. to grow?
Growth engine :Break revenue into Price, Volume, Mix. Who grows by charging more, who by selling more, who by shifting to premium?
History & culture :What shocks shaped this industry (recessions, commodity spikes, tech shifts)? What playbooks became standard?
Goal: understand how the business model actually works, and how insiders learned to handle cycles.
Here’s a prompt to use:
Replace Consulting Advisory with your sub-sector.
Run it in DeepSearch , it scans hundreds of filings, calls, and industry notes, then gives you a full report.
ROLE: Operations & finance analyst.
CONTEXT: I want to understand the operational economics of the IT Consulting & Services,Advisory & Enterprise including its history and growth engine.
TASKS:
Core Processes & Cost Structure
Main production or service processes.
Cost breakdown: fixed vs variable.
Key bottlenecks (labor, assets, raw materials, tech).
Unit Economics
Typical Gross margin, EBIT margin, ROCE, and FCF conversion.
Cash conversion cycle (DSO, DIO, DPO, CCC).
Capex needs: maintenance vs growth (as % of sales).
Growth Engine (Price vs Volume vs Mix)
Volume drivers (penetration, frequency, installed base).
Price drivers (pricing power, pass-through, inflation).
Mix drivers (premiumization, customer/geography/product shifts).
Cyclicality & Operating Leverage
Sensitivity of revenues and margins to downturns.
Evidence from past recessions/crises (5–10y history).
Impact of utilization swings on profitability.
Industry History & Evolution
Major turning points in the past 10–20 years (tech shifts, crises, consolidation waves).
Standard “playbooks” used in downturns (cost cutting, outsourcing, consolidation).
Cultural or operational norms that shape how firms run today.
Benchmarks & Spreads
5–7 representative public companies: name, ticker, segment.
Benchmark table: Gross margin, EBIT margin, ROCE, FCF conversion, Capex/Sales.
Best vs median vs laggard performance.
OUTPUT FORMAT:
Bullets for explanations.
Tables where possible:
Unit Economics → Metric | Typical Value/Range | Why it matters
Growth Drivers → Driver | Evidence | Impact on revenue/margins
Benchmarks → Company (Ticker) | EBIT% | ROCE | FCF/EBITDA | Capex/Sales
END WITH (Fast Tests):
If sales froze for 6 months, what costs keep burning?
Which driver (price, volume, mix) explains most growth in the last cycle?
In a downturn, which lever is most critical for survival?
What playbook did winners use in past crises that losers missed?
AI turns filings and transcripts into 12 pages you can read in 10 minutes.
Margins, cash flow, reinvestment ..all in one place.
That’s all you need: a clear view of the operating engine.
Next step: the tactical levers managers can pull inside the business.
Step 4 : Identify tactical levers
After you understand how the business works, look at the actions managers can take.
These are the levers they can pull in the upcoming quarters to protect margins and cash.
Here’s what to look for:
Revenue levers : pricing tweaks (discounts, surcharges, indexation), upsells, renewals.
Cost levers : better utilization, temp labor vs overtime, cutting unprofitable SKUs, renegotiating suppliers.
Cash levers : faster collections, stretching payables, reducing inventory.
Pitfalls : quick fixes that cause damage: cutting prices too deep, starving R&D, delaying maintenance.
This part matters because it shows the difference between bad short-term actions and the choices that actually protect long-term value.
Here’s a prompt to use:
Replace Consulting Advisory with your sub-sector.
Run it in DeepSearch :
ROLE: Tactical operator & competitor analyst.
CONTEXT: I want to understand the short-term competitive levers in the IT Consulting & Services, I’d focus on Advisory & Enterprise
TASKS:
Revenue Levers
Pricing levers: discounts, surcharges, contracts, indexation.
Volume levers: distribution channels, salesforce, product mix.
Retention: churn drivers, contract renewals, loyalty tactics.
Cost & Efficiency Levers
Short-term cost levers: outsourcing, temporary labor, renegotiating sourcing.
Productivity/throughput improvements.
SKU/product rationalization.
Cash Levers
Billing models: prepayments, milestone billing.
Collections: terms tightening, incentives.
Inventory and supplier terms.
Common Playbooks & Pitfalls
Typical “fast wins” that operators use in downturns.
Pitfalls that destroy long-term value (e.g., permanent price cuts, starving R&D).
Benchmarks & Examples
Examples from 3–5 public companies showing tactical actions in the last downturn or crisis.
Short case bullets: action taken, impact on revenue/margins.
OUTPUT FORMAT:
Bullets for explanations.
Tables where possible:
Tactical Levers → Lever | Example in this industry | Likely impact
Case Examples → Company | Action | Result
END WITH (Fast Tests):
If a rival cuts price by 5% tomorrow, what 3 actions can firms in this industry take within a quarter?
Which lever is usually most effective in a downturn: price, volume, or cost?
What is the most common tactical mistake companies make?
The output is a tactical playbook you can skim in 10 minutes.
Once you have it, you’re ready for the final step.
Step 5 :Understand where power sits
Short-term levers buy time.
But long-term returns depend on pricing power and moats: who has them, how strong they are, and what could break them.
Here’s what to look for:
Customer power : Are buyers fragmented or concentrated? How hard is it for them to switch?
Supplier power : Are there choke points (unique inputs, IP, platforms, regulators)?
Moats : scale (costs fall with volume), network effects (value grows with density), brand (stable premium, low CAC), regulation/IP (licenses, patents).
Fragilities : substitutes, commoditization, vertical integration, regulation shifts.
Here’s a prompt to use:
Insert your your sub-sector.
ROLE: Strategy consultant.
CONTEXT: I want to understand the long-term positioning and power dynamics in the [INDUSTRY XXX].
TASKS:
Power Map
Who holds power: customers, suppliers, regulators, platforms.
Buyer concentration and switching costs.
Supplier dependency, input choke points, platform lock-ins.
Why Customers Buy & Stay
Jobs-to-be-done: core pain/gain solved.
Evidence of stickiness: switching costs, integrations, ecosystem lock-in.
Moats (with evidence)
Scale advantages (unit cost curve, bargaining power).
Network effects (value ↑ with adoption).
Brand/trust (stable price premium, low CAC).
Regulation/IP (licenses, patents, compliance barriers).
Fragilities
Tech substitution risk.
Vertical integration by customers/suppliers.
Regulatory shifts or platform rule changes.
Capital Allocation & Incentives
How leaders reinvest capital (organic vs M&A vs buybacks).
Historical ROCE on reinvestment.
Management incentive structures (value-creating vs vanity).
OUTPUT FORMAT:
Bullets for clarity.
Tables where possible:
Moat Test → Moat type | Evidence | Implication
Power Map → Stakeholder | Source of power | Impact on margins
Fragilities → Risk | Trigger | Potential impact
END WITH (Fast Tests):
In 10 years, why will customers still stay or leave?
If a new entrant had €200M today, where would they attack first?
What must remain true for this industry to stay attractive?
With this last step, you now have a solid understanding of a sub-sector all in under 60 minutes.
What comes next is up to you.
You can go deeper on one player by reading annual reports…
or move on to the next sub-sector and repeat the process.
Either way, this framework makes it much easier to keep expanding your circle of competence, one focused step at a time.
Recap : Expand your circle in 5 steps
In one month, you can take any sub-sector from “unknown” to “inside your circle of competence.”
Choose what to study
Map the macro environment
Understand unit economics
Identify tactical levers
Test strategy & moats
Each step = one DeepSearch prompt.
Each output = a cheat sheet you can read in 10–15 minutes.
Four weeks later, you’ve built an investor-grade industry packet.
If this helped you, send it to one investor friend who should be expanding their circle too.
And if you want the next framework straight in your inbox, subscribe here