
How to compare 10 years of filings in minutes with AI
Claude found an $18B change in Microsoft’s filings.

As investors, we massively overestimate how much we notice in filings.
And massively underestimate what AI can find.
Here’s a simple example.
TThese are 2 sentences from Microsoft’s 10-Ks, 12 months apart:
July 2024: “Intelligent Cloud revenue: $105,362 million.”
July 2025: “Intelligent Cloud revenue: $87,464 million.”
The disclosure was a footnote.
But suddenly, $18 billion disappeared from Intelligent Cloud.
And before that change, some analysts were using those numbers to support the idea that Microsoft’s cloud business was bigger than AWS.
To be clear: this doesn’t mean Microsoft is “bad” or hiding something.
This is normal.
The point is simple:
Small changes in annual reports can change how investors see a business.
And catching all of those changes manually is extremely hard.
That’s where AI becomes interesting.
I built a Claude skill that compares years of filings side by side to find:
accounting changes
segments that moved
KPIs that disappeared
metrics that changed definition
and shifts in the business story over time
Download the skill, install it once, and run it on any stock you follow.
In this video, I’m sharing the output using Microsoft as the example.
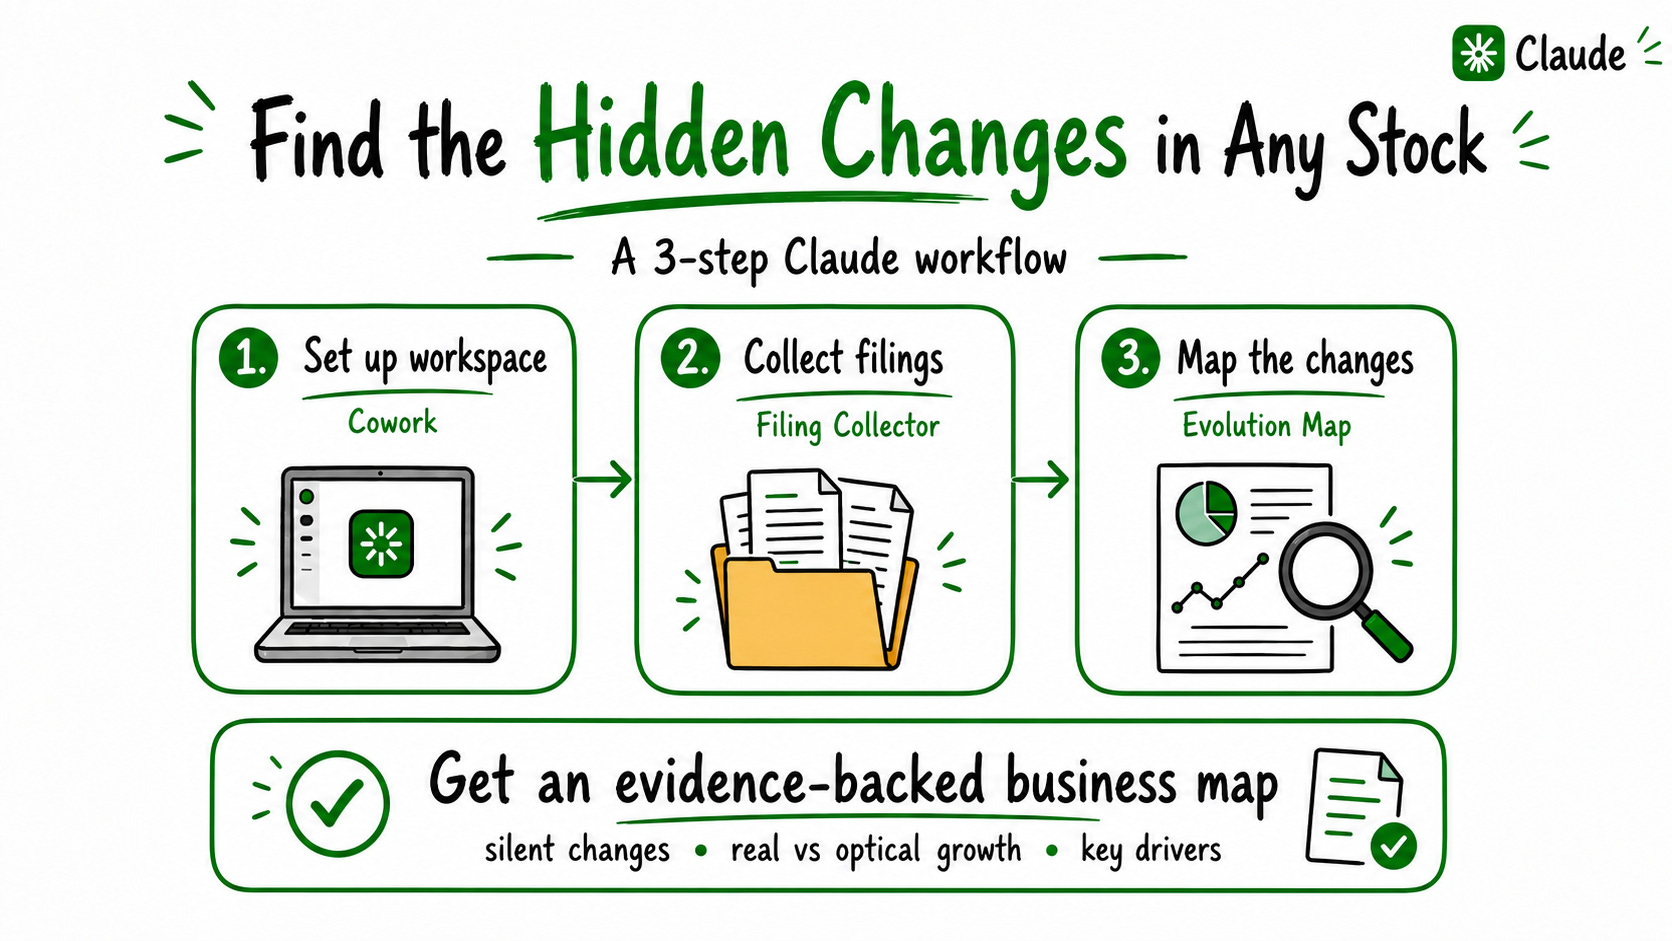
How this claude skill turns years of filings into a clear business evolution map:
We will use skills inside Claude.
Reminder: A Skill is simply a file you upload once into Claude.
Inside it are repeatable workflows and instructions.
Claude can then run the same steps consistently on any stock.
The idea is simple:
Make claude compare years of filings side by side and track what quietly changed.
How it works:
1/Download my Skill file.
2/Upload it once into Claude.
3/Type the stock name.
4/Claude creates an interactive web page that shows:
where KPIs disappeared
where definitions changed
what changed in the reporting
where useful lives got extended
where acquisitions inflated growth
what deserves a deeper read and analysis
Create Your Own Business Evolution Map in Minutes
Step 1: Use Claude Cowork
We’re building this inside Claude Cowork.
It’s the desktop version of Claude that can access files on your computer, run workflows across many filings.
Why Cowork instead of normal chat?
Normal Claude chat is great when you don’t need to read lots of precise files.
But ,here we want Claude to work across:
Earnings transcripts
10 years of annual reports
Multi-document comparisons
That needs a proper research environment.
That’s what Cowork gives you.
Your documents stay organized in folders on your computer.
Claude can:
Open files automatically
Pull the important information
Run the workflow step by step
Save the outputs directly
Instal the claude app and start using it
Open the official Claude website
Download Claude Cowork
Install the app
Log into your Claude account
Open Cowork
Start a new chat
Go to Step 2
Step 2: Group all the official filings into one folder
Pick the company you want to analyze.
Create a folder on your desktop named after the ticker
You need the last 5–7 years of:
10-K annual reports for US companies
20-F or equivalent annual reports for non-US companies
This is the raw material.
But you don’t need to collect everything manually.
You can do it yourself for fun…
If your definition of fun is opening 47 tabs and downloading PDFs.
I’d rather let Claude handle that part.
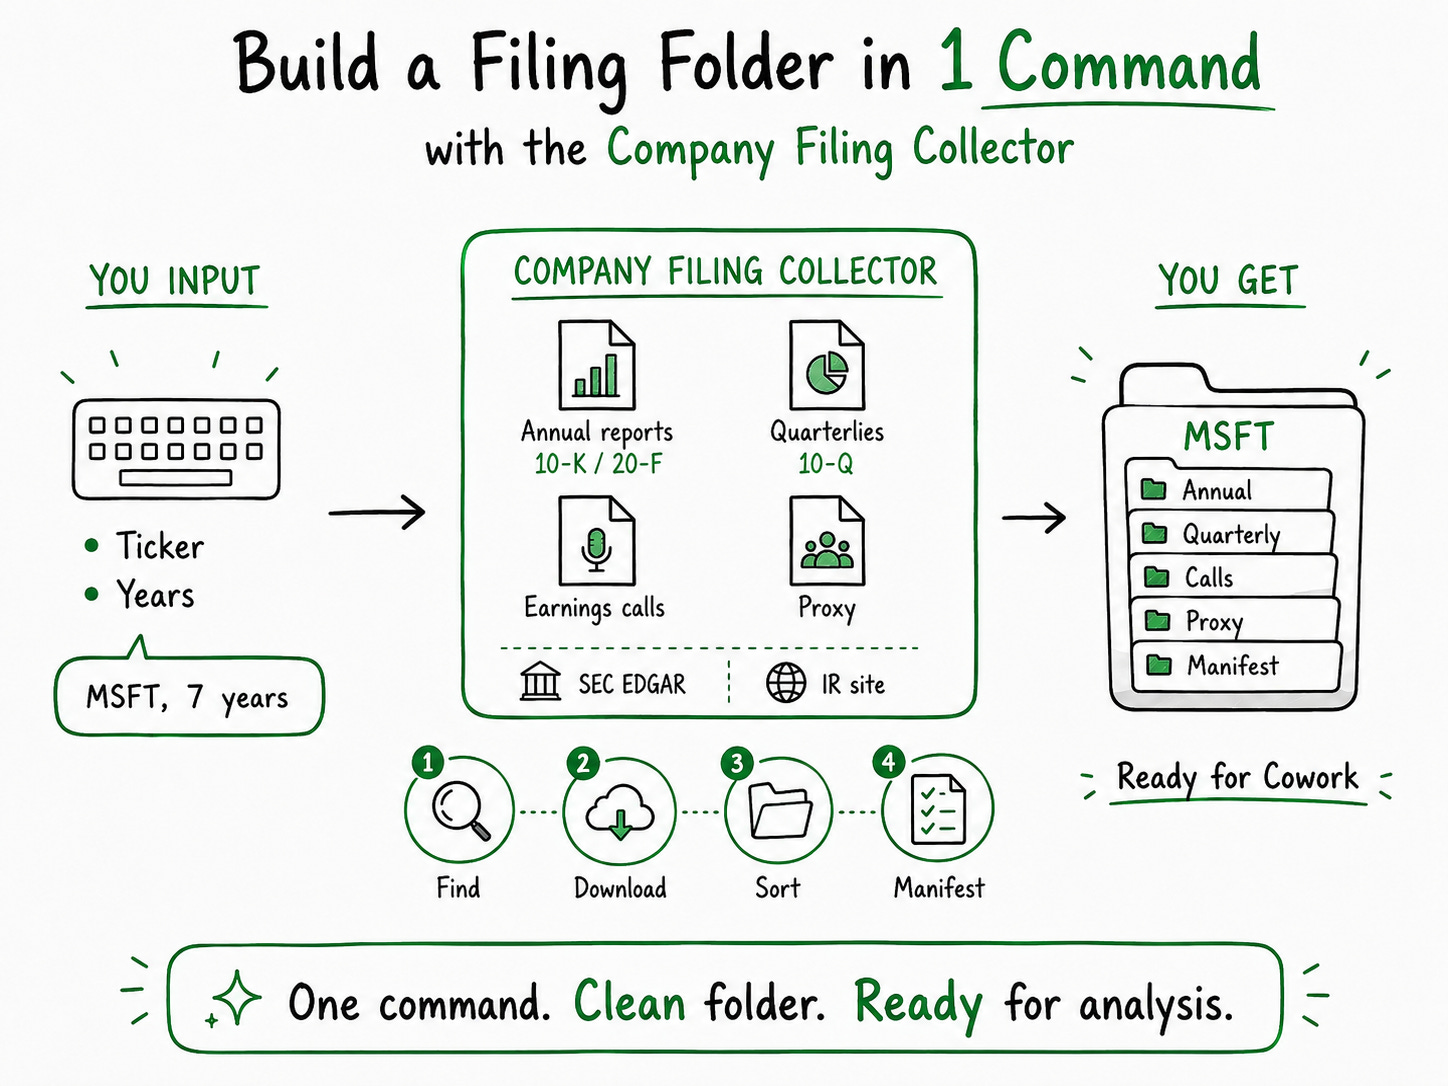
So I built a Filing Collector skill.
You give Claude:
the ticker
the number of years you want
And it builds the folder for you, instead of spending 30 minutes downloading documents one by one.
Step 3: Run the Business Evolution Map
Now open Claude Cowork.
Start a new chat.
Give Claude access to the folder you created in Step 2.
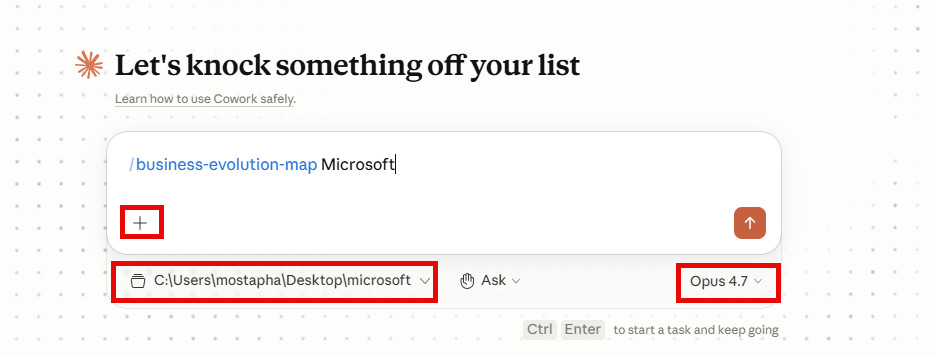
Then:
Click “+”
Select Business Evolution Map
Type the company name
Run the skill
Wait a few minutes.
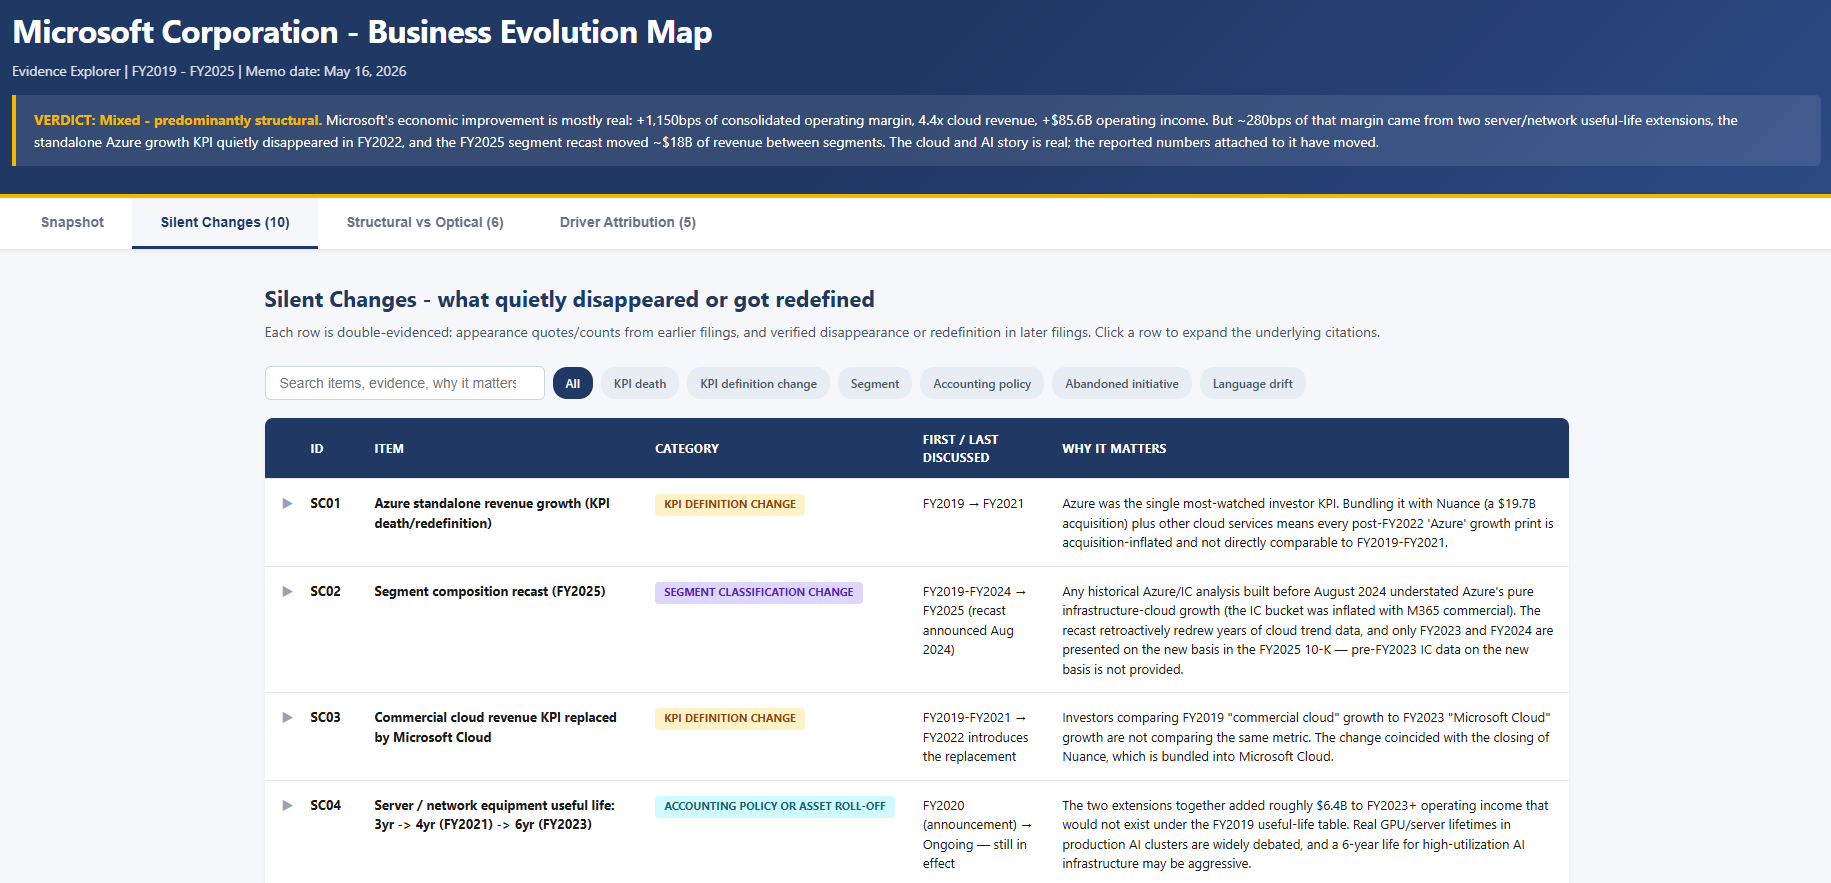
You’ll get an interactive web page with:
what quietly changed in the reporting :disappearing KPIs, accounting changes, segment redefinitions
what improvements were truly real :real business improvement vs accounting, acquisitions, buybacks, or cycle effects
what actually drove the business changes: the main reasons revenue, margins, or cash flow changed over time
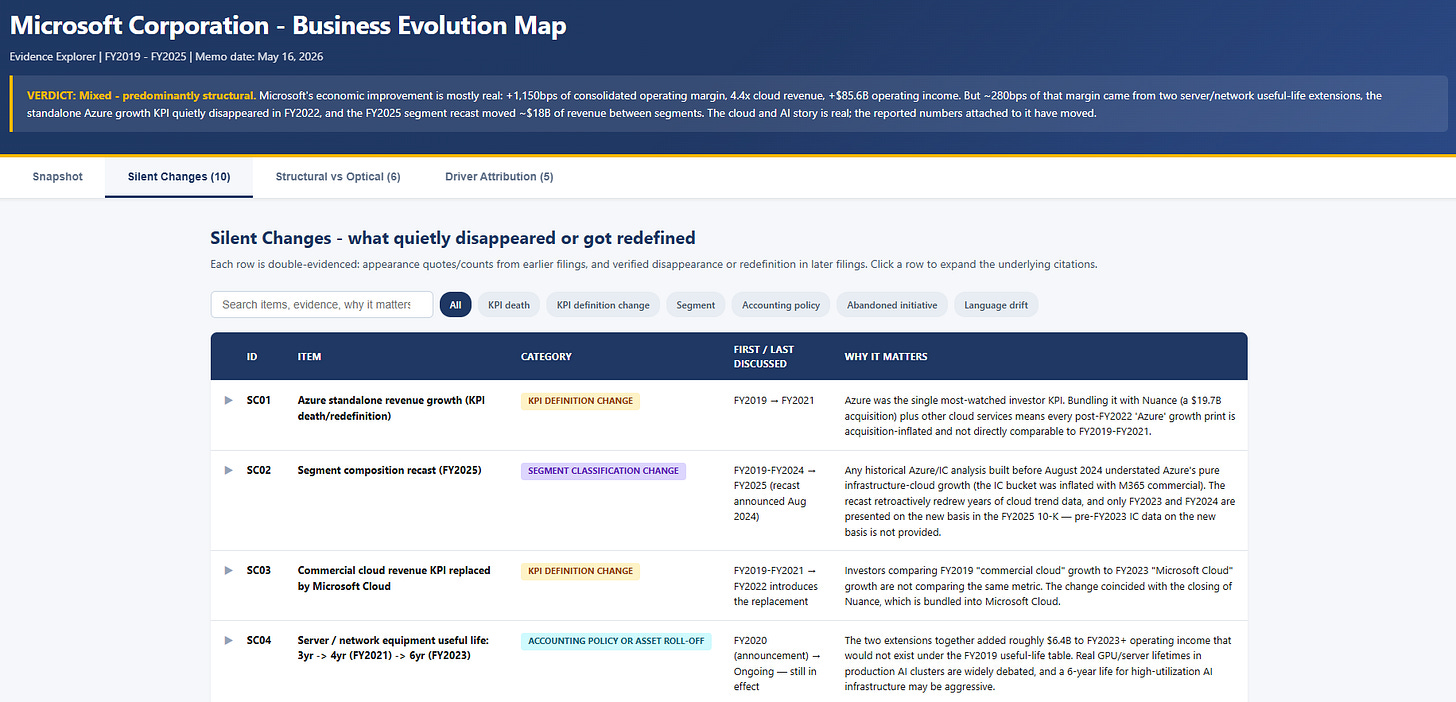
Example output: an interactive “Business Evolution Map” that shows what quietly changed inside the company over time.
Upload the skill once. Use it forever.
Download this file.
Inside, you’ll find 2 Claude Skills:
Filing Collector : downloads all company filings automatically
Business Evolution Map : reads years of filings side by side and maps what really changed in the business