
How To Spot Fake Low P/E With 3 Prompts
...And Avoid the -85% Loss

Hello, Fellow Stock Picker
Last week I came across a stock I had looked at 3 years ago.
Back then, it was trading at 6× P/E with net cash.
I spent a lot of time analyzing it but didn’t buy because it was cyclical.
Today the stock is down –85%.
I smiled, happy I hadn’t invested…
But I also felt frustrated, remembering how much time I had wasted on it.
That’s when it hit me. The risk isn’t just losing money.
It is also losing time on traps that look cheap but aren’t.
So I asked myself: how can AI help me avoid both?
Here is the framework I now use.
A way to test in whether a low P/E is real value or just noise :
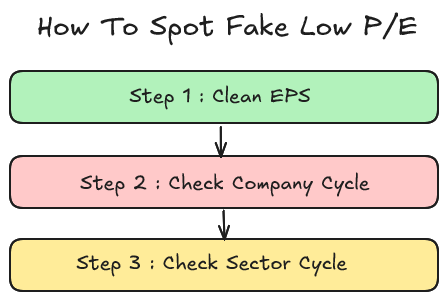
Step 1 : Clean EPS Check
It’s a PE of 6 but Are the earnings real and repeatable?
GAAP earnings are messy.
One-offs, discontinued operations or tax tricks can all make EPS look better than it really is.It says P/E of 6. But are the earnings real and repeatable?
GAAP earnings are messy.
One-offs, discontinued operations, or tax tricks can all make EPS look better than it really is. Before you trust the P/E, you need to clean it.
Red flags to watch for:
“One-time” items that keep coming back
Clean EPS more than 10–15% below GAAP EPS
Effective tax rate much lower than the 5-year median
How to do it with AI
Use NotebookLM as the main tool.
Load the last 5 annual reports.
Run this prompt:
Find NON-CYCLICAL EPS inflaters, quantify impact, and build a GAAP→Clean EPS view. Cite every claim (doc, page/slide).

RULES
- If not disclosed → “Unknown”. Keep currency/units.
- Use weighted-avg **diluted** shares for per-share math.
- If GAAP EPS missing: compute = NI to common ÷ diluted shares (cite both).

CHECKPOINT IDs (one row each)
A1 Disposal gains; A2 Litigation/insurance gains; A3 MTM/derivative gains.
B1 Bill-and-hold/channel stuffing; B2 Capitalized expenses; B3 Longer useful lives; B4 Reserve releases; B5 Recurring “one-time” add-backs (8Q); B6 Losses in discontinued ops; B7 IFRS FV gains (property/biological).
C1 Seasonality inflates TTM; C2 Favorable mix; C3 FX tailwind vs 3y; C4 Commodity tailwind.
D1 Low ETR vs 5y median; D2 Deferred tax remeasurement.
E1 Buybacks (shares ↓, NI flat); E2 Cheap debt/holidays/PIK; E3 Capitalized interest.
F1 WC release “sugar high”; F2 SCF/factoring optics.
G1 PPA/negative goodwill; G2 Equity-method one-offs.

CALC
EPS Impact = after-tax amount ÷ diluted shares (if pre-tax only, mark “After-tax? = No”).
% of GAAP EPS = (EPS Impact ÷ GAAP EPS) × 100.

OUTPUT — PART 1 (bullets first)
**Problem Summary (sorted by % of GAAP EPS)**
- **[ID] Name — EPS Impact: X.XX; %: YY.Y%** — short reason. Source (doc,page)

If none: **Problem Summary: None found**.

OUTPUT — PART 2 (then ONE table)
| ID | Checkpoint | Period | Problem? (Yes/No/Unknown) | Amount (ccy) | After-tax? | EPS Impact | % of GAAP EPS | 1-line reason | Evidence (short quote) | Source (doc,page/slide) |

Notes: Prefer TTM; else FY; else latest Q (label). Aggregate multiple hits within Period; provide 2–3 representative cites. Output ONLY the bullets then the table.
What the results look like
First, you’ll see a short summary.
Then you’ll get a master table with every checkpoint, the EPS impact, % of GAAP EPS, and direct citations.
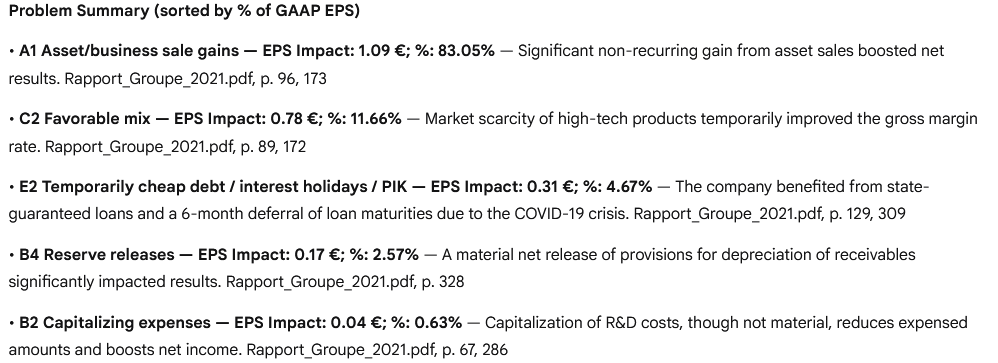
And sometimes the difference is dramatic.
If exceptionals inflate half of earnings and P/E shows 6×, the reality is closer to 12×. That changes everything.
Which brings us to the next checkpoint: even “clean” earnings can still be at peak cycle.
Step 2: Company Cycle Check
Do the company’s own numbers look “peak-y”?
Focus on the annuals and last 8–12 quarters.
Red flags to watch for
Gross margin or EBIT margin far above the company’s 10-year median
Sudden step-ups in margin without matching capex, mix or pricing proof
Favorable segment mix vs the 3-year average
FX or commodity tailwinds vs the 3-year average
How to do it with AI
Tool: NotebookLM
Load: last 5 annual reports
Run this prompt
From filings, flag if results look above mid-cycle. First give clear bullets, then a concise table. Cite every claim (doc, page/slide). If unclear → “Unknown”. Prefer TTM; else latest FY (label).

RULES
- No “Calculated” as a source: cite the input pages used.
- Add a magnitude whenever disclosed (bps or % of GAAP EPS).
- Fallbacks: Seasonality→use quarterly GP/Rev (or H1/H2) if EPS/NI missing; Mix→use disaggregation (product/geo) if single segment; FX/Commodities→use qualitative quote if not quantified.

CHECKS (in order)
1) Margins >> history (GM%/EBIT% vs 10Y median; RED > +300 bps or > +1.5σ)
2) Step-up without proof (>+200 bps QoQ/YoY; proof = capex/mix/pricing)
3) Seasonality boosting TTM (flag if >10%; 5–10% = AMBER)
4) Favorable mix vs 3Y average (use disaggregation fallback)
5) FX/commodity tailwind vs 3Y average (material ≥100 bps margin or ≥5% EPS)

OUTPUT — PART 1 (plain-English bullets, REDs first, then AMBERs)
Red-Flag Summary
- **[Check] — Status: RED/AMBER. What it means:** ≤12 words. **Magnitude:** X bps or YY.% of GAAP EPS. **Source:** doc,page/slide
- If none: **Summary: No red flags found.**

OUTPUT — PART 2 (table only)
| Check | Status (Red/Amber/Green/Unknown) | Trigger (≤6 words) | Magnitude (bps or %EPS) | Evidence (short quote) | Sources (doc,page/slide) | Data gap (if Unknown) |

Only output the Summary bullets, then the table. No extra text.
What the results look like
A short problem summary, then a table with Seasonally Adjusted EPS, Mid-Cycle EPS (company-only), and FX/mix-neutral EPS.
This tells you if the business looks “too good” on its own numbers before checking the wider market.
Even if the company looks peak-y, you need to ask if the whole sector is also at peak. That is where sector context matters.
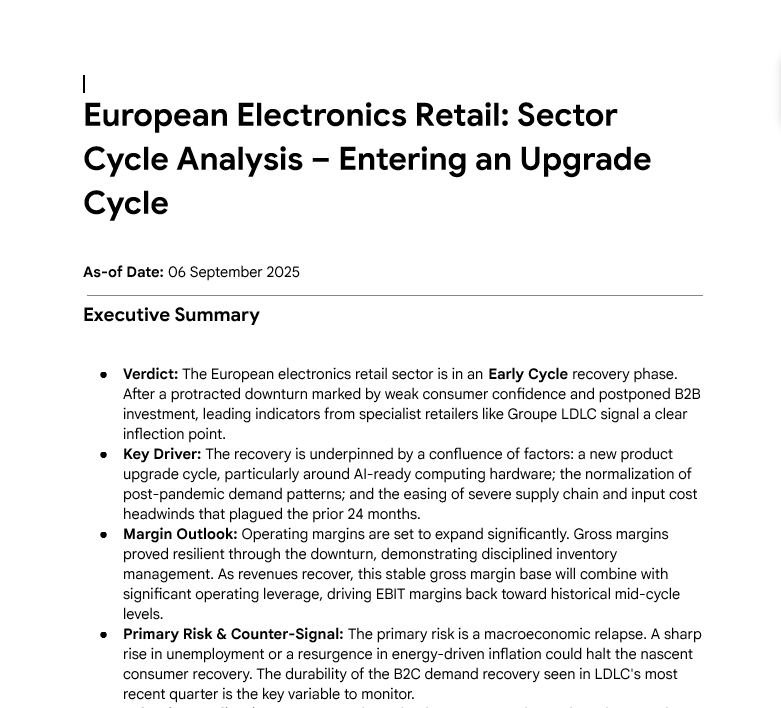
Step 3: Sector Cycle Context
At this point, you’ve stripped the accounting noise.
You’ve checked if the company’s numbers are above mid-cycle.
Now it’s time to zoom out: where are we in the industry cycle?
Red flags to watch for
Margins are far above 10-year medians
Fresh capacity adds or demand slowdowns in trade press/industry reports
Price increases rolling over in channel checks or transcripts
Input costs normalizing after a temporary windfall
How to do it with AI
Tools: DeepSearch in Gemini
NotebookLM is great for cleaning company numbers.
But here you need broader context,capacity, pricing, inputs across multiple sources. That’s where DeepSearch shines.
Run this prompt:
ROLE
You are a senior buy-side analyst and long-term investor. Produce a consulting-grade SECTOR cycle report starting from a single company name. Be precise, source-bound, and reproducible.

INPUT
Company: [COMPANY NAME]

RESOLVE UPFRONT (with citations)
- Ticker, exchange, country/region, reporting currency, fiscal year-end.
- Sector classification (NAICS/SIC/GICS) and short description.
- Fix a peer set (6–10 names): same classification, similar model, continuous listing ≥8y (fallback 5y). List tickers; LOCK this set.
- State an explicit **as-of date** in the report header.

SOURCE PRIORITY
1) Company/peer filings & transcripts; 2) Trade associations/regulators/index publishers; 3) Reputable trade press.
Each material fact: 1–2 links + ≤18-word quote. If unavailable → **Unknown** + “Data gap: [what to fetch]”.

WINDOWS
Margins: 10y (fallback 5y). Capacity/Pricing/Demand: 24–36m. Inputs/FX: vs 3y average. Use TTM for “current”; else latest FY (label).

QUALITY & NORMALIZATION
Normalize to **continuing ops** where disclosed; note restatements/policy changes. Keep units/currency; round bps/% sensibly.

SECTOR PROFILE (choose & state why)
- Commodities/CapGoods | Weights: Margins 25, Capacity/Demand 45, Pricing 20, Inputs 10
- Consumer/Retail      | Weights: Margins 35, Capacity/Demand 25, Pricing 25, Inputs 15
- Software/Services    | Weights: Margins 45, Capacity/Demand 15, Pricing 25, Inputs 15

TASKS (do in order)

1) MARGINS vs HISTORY & SECTOR
- Table: Company EBIT% (TTM/FY) | Company 10y median | Peer 10y medians → Sector median | Δ vs company (bps) | Δ vs sector (bps).
- FAR ABOVE = >+300 bps vs company and >+300 bps vs sector median (fallback: >+1.5σ if σ available). Note GM% if materially different.

2) CAPACITY & DEMAND (24–36m)
- Timeline (≤8 rows): [Asset/Region] | Δ capacity (units/Mt/GW/%) | Status (announced/under-construction/commissioned/idled/closed) | Commissioning/Qtr | Slip-risk (H/M/L + quote) | Direction (Tightening/Loosening).
- Demand proxies: book-to-bill, backlog level/quality, utilization, cancellations, shipments/units (numbers if disclosed). Two sources for major items. Summarize net direction.

3) PRICING TREND (12–24m)
- Realized ASP preferred; label **LIST** if list price only. Extract phrases: “discounting”, “promotional”, “givebacks”, “smaller hikes”.
- Add 1–2 relevant spot indices vs 12m avg. Verdict: Rising / Flat / Rolling over.

4) INPUTS & FX (vs 3y average)
- For each key index/FX: Current vs 3y avg (%).
  Tailwind% = (3y avg − current)/3y avg; Headwind% = (current − 3y avg)/3y avg.
- If hedged: EffectiveTailwind% = Tailwind% × (1 − hedge coverage). Note tenor/coverage.

5) MIX & SEASONALITY (only if material)
- Mix: last 8Q segment Rev/EBIT mix vs 3y average; flag profit-heavy skew & durability evidence.
- Seasonality: indicate if current run-rate is above typical seasonal pattern (quarter/half-year evidence).

6) CYCLE SCORE & VERDICT (transparent)
- Start at 0; apply chosen sector **weights**:
  • Margins FAR ABOVE +2; Inline 0; Below −1
  • Capacity/Demand Loosening +2; Mixed +1; Tightening −1
  • Pricing Rolling over +1; Flat 0; Rising −1
  • Inputs Tailwind fading/Normalizing +1; Tailwind strong 0; Headwind −1
- Sum weighted score → **Cycle class**: ≥+3 Late Top; −1…+2 Mid; ≤−2 Early; strong negatives + falling margins & demand → Downturn.
- **Confidence (H/M/L)** rubric (0–6): +1 diverse source families; +1 ≥2 independent sources for capacity/pricing; +1 peer coverage ≥80% of fixed set; +1 accounting normalized; +1 hedging captured; +1 no critical data gaps.

7) THROUGH-CYCLE ANCHORS (sector → company)
- Sector mid-cycle EBIT% = sector 10y median (state range if needed).
- Company mid-cycle EBIT% anchor = company 10y median, cross-checked vs sector anchor; justify choice.
- If FX/inputs tailwind material, present **neutral** view using EffectiveTailwind%. If mix skewed, add **mix-neutral** note.
- Provide a quick **mid-cycle EPS anchor** for the company if inputs exist (TTM revenue, mid-cycle EBIT%, normalized tax via 5y median ETR, diluted shares). Else: “Unknown (Data gap: [x]).”

DISCOVERY BAND (max 3 items)
Surface up to 3 non-obvious signals that could change the verdict (lead times, channel inventory, secondary equipment prices/day-rates, hiring trends). Quote + link.

OUTPUT — EXACT SECTIONS

1) Executive Summary (≤15 bullets)
2) Method & Dataset (peer rule, windows, normalization; as-of date)
3) Margins vs History & Sector (table)
4) Capacity & Demand (timeline + net direction)
5) Pricing Trend (direction + 1–2 quotes + indices)
6) Inputs & FX (Tailwind/Headwind/Normalizing)
7) Mix & Seasonality (only if material)
8) Cycle Score & Verdict (score, class, confidence + why)
9) Through-Cycle Anchors (sector & company; EPS anchor or data gap)
10) Discovery Band (≤5 signals)
11) Evidence Table (max 12 rows)
   | Factor | Indicator | Direction | Magnitude | Evidence (≤50 words) | Source (link) | As-of |
12) References ([S1]… numbered, clean links; dedupe)

CONSTRAINTS
Quotes ≤50 words; max 12 evidence rows; de-duplicate links; mark each evidence row with an **as-of date**.
If a metric is missing → **Unknown** + “Data gap: [what & where to get it]”.
The output: a 13-pag report that shows exactly where the industry stands in the cycle.
Recap
AI won’t choose stocks for you.
But it will keep you from wasting weeks on a low P/E that’s really a trap.
The workflow is simple:
Step 1: Clean the earnings :strip out exceptionals.
Step 2: Check the company’s numbers:see if margins look peak.
Step 3: Put it in sector context :know where the cycle really is.
Do this in 30 minutes, and you’ll know if 6× P/E is real value… or just noise.