
I Built My Own Industry Analyst With AI
How to Build Yours in 5 Steps

Imagine an industry expert who answers all your questions, remembers everything , and costs 0$?
I’ll show you how to build it in 5 steps with NotebookLM.
Lately I’ve been diving into the payments industry, so I built my own industry mentor to help me connect the dots.
By the end of this newsletter, you’ll get a free gift: a ready-to-use Payments Analyst Notebook you can start using right away
But first, let me show you how to build your own:
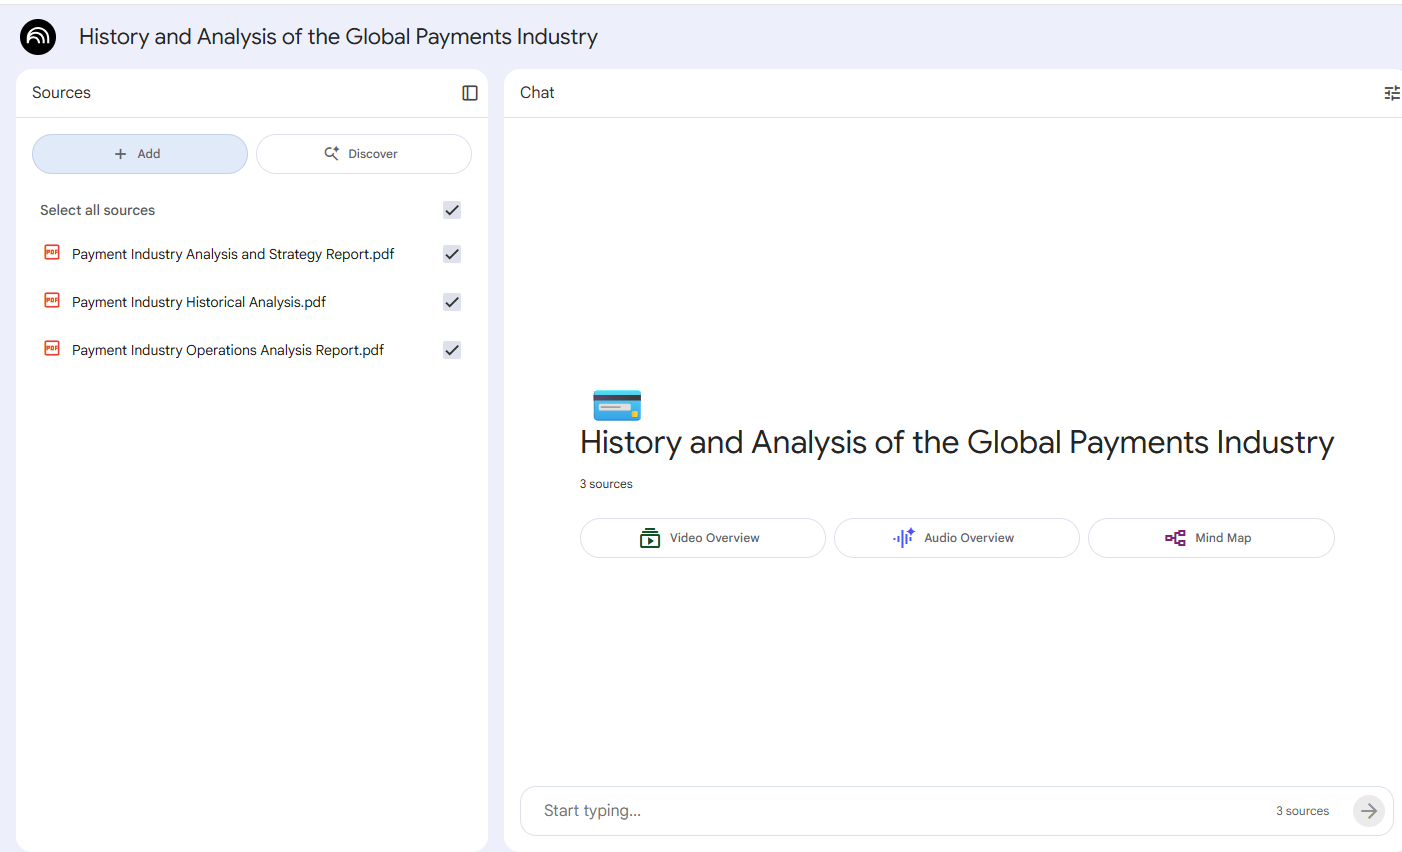
Step 1: Identify your sources
we will use NotebookLM , it does what other models can’t:
Handles hundreds of pages at once.
Answers only from your sources, with citations and no hallucinations.
Powered by Gemini 2.5 Pro, it combines a million-token context, document indexing, and source-bound reasoning in one place.
That’s great ..but NotebookLM forces you to pick your sources first.
It’s like hiring a smart analyst… but still needing to hand him the textbook.
So before you upload anything, slow down.
Choose wisely.
Because your analysis is only as strong as your sources.
I like a mix of:
7 public business annual reports.
If you don’t know where to start, just ask ChatGPT for the biggest companies in your industry and grab their latest reports.3 reports I generate myself using Gemini Deep Research.
These are tailored to check the most important things in a business.I’ll share the exact prompts for that in the next step.
A few free expert papers or industry articles.
They give outside perspective and fill in the gaps.
And yes , I also ask ChatGPT to find the best three free reports.
Step 2: Generate Your 3 Deep Research Reports
The most important sources are the ones you create yourself.
I use 3 Deep Research prompts in Gemini to teach NotebookLM any new industry:
History :how the industry started, evolved, and who the main players are.
Growth & Future : what’s driving it forward, what’s holding it back, and what the next decade might look like.
Operations & Economics : how it actually works today: the value chain, costs, and profit drivers.
Together, they give you the full picture about past, future, and how the money moves in between.
It’s my way of giving my AI assistant an industry crash course
Prompt 1: Historical Analysis
Run this prompt inside Gemini Deep Research , it’ll generate a detailed 30-page report.
Then export that report into NotebookLM.
ROLE
You are an economic historian and industry analyst.
Write a factual, data-based history of the [Industry Name] showing how it formed, evolved, and produced its major winners.
Use clear, analytical language focused on cause and effect.

OBJECTIVE

Create one detailed report (8 000–10 000 words) that explains:

How the industry began and why it matters economically.

What forces—technology, regulation, capital, competition—shaped it.

How leading firms gained and kept advantage.

What cycles or patterns repeat across time.

What lessons guide long-term investors.

REPORT OUTLINE

Formation

Initial need and early solutions.

First technologies, financing models, and institutions.

Context and early dominant players.

Expansion

Breakthroughs that enabled scale.

Evolution of cost, productivity, and barriers to entry.

Standardization and global reach.

Crises and Regulation

Major shocks that reset structure.

Policy and regulatory shifts.

Consolidation and impact on profitability.

Competition

How leading firms built edge (cost, tech, brand, network).

Failures and structural limits.

Turning points in market share and returns.

Industry Players (additional focus)

Main actors in each period.

Why they dominated and when leadership changed.

Key mergers or breakups that reshaped the sector.

Modern Transformation

Digital and automation shifts.

New entrants and business model changes.

Effects on margins and capital allocation.

Regional Differences

Trade, subsidies, and geographic factors.

Capital and Returns

Financing evolution, leverage, and return patterns.

Changes in investor perception and valuation.

Key Insights

Recurrent mechanisms of success and failure.

Structural risks that persist.

Long-term investment implications.
Prompt 2: Growth & Future
ROLE

You are an industry analyst and strategist.

Write a factual, forward-looking report on the [Industry Name] explaining current growth drivers, structural limits, and plausible future scenarios.

Use analytical, quantitative, and cause-effect reasoning.

OBJECTIVE

Create one long report (≈ 8 000–10 000 words) that explains:

Current state and growth momentum of the industry.

Key demand and supply drivers.

How regulation, technology, and capital cycles affect expansion.

Emerging business models and competitive shifts.

Long-term scenarios, opportunities, and risks for investors.

REPORT OUTLINE

Current Structure

Market size, segmentation, and value chain.

Profit pool concentration and key players.

Geographic exposure and demand balance.

Growth Drivers

Demand-side factors (demographics, consumption, adoption).

Supply-side enablers (capacity, input cost, innovation).

Policy, regulation, or funding stimuli.

Constraints and Headwinds

Regulation, resource limits, or substitution risk.

Competitive saturation or pricing pressure.

Cyclicality and capital-intensity barriers.

Technological Evolution

Innovations with material economic impact.

Expected cost curve changes or productivity gains.

Automation, AI, and data effects on margins and scale.

Competitive Landscape

New entrants, consolidation trends, and global rivalry.

Shifting power between incumbents and disruptors.

Economic moats under construction or erosion.

Scenarios (5–10 Years)

Base case – continuation of current trends.

Upside – faster adoption or new tech.

Downside – policy, pricing, or capital shock.

Probability estimates and key leading indicators.

Financial Outlook

Revenue, margin, and ROCE expectations.

Investment and capex cycles.

Valuation and cost-of-capital sensitivity.

Strategic Implications

What capabilities or assets will define winners.

Where capital should or should not flow.

Structural risks that investors must monitor.
Prompt 3 : Operational Structure and the economics
ROLE
You are an industry economist and operations analyst.
Write a precise, technical report explaining the complete operating logic of the [Industry Name]
its value chain, cost drivers, cash flows, and efficiency mechanics.
Use causal, quantitative reasoning throughout.

OBJECTIVE

Produce a full-length analytical document (≈8 000–10 000 words) that answers:

How does the industry convert inputs into output and cash?

What determines margins, returns, and scalability?

How do firms organize capital, labor, and technology to stay efficient?

Which metrics expose operational strength or fragility?

What makes a top-quartile operator different from the median?

REPORT OUTLINE
1. Value Chain and Flow of Goods or Data

Describe every stage from input to customer delivery.

Identify main actors (suppliers, producers, distributors, retailers, platforms).

Quantify value added and time delays at each link.

Map material, information, and cash flow direction.

Explain integration trends (vertical, horizontal, outsourcing).

2. Operating Models and Revenue Logic

Typical contract and pricing mechanisms (subscription, per-unit, spread, fee).

Capacity utilization vs demand management.

Mix of fixed and variable revenues.

Cost-pass-through behavior and sensitivity to input changes.

Profit-pool concentration across the chain.

3. Cost Structure and Margin Drivers

Break down operating expenses: raw inputs, energy, transport, labor, depreciation, maintenance, regulation, marketing.

Quantify cost shares and volatility.

Explain economies of scale, scope, and density.

Identify non-linear cost behaviors (threshold effects, bottlenecks).

Show how leaders maintain gross-to-EBIT conversion advantage.

4. Working Capital and Cash Conversion

Payment cycles (DSO, DPO, inventory days).

Cash-conversion drivers and stress points.

Seasonal cash flow patterns.

Impact of prepayments, float, or deferred revenue.

Typical financing structure for operations.

5. Asset Base and Capex Economics

Composition of fixed assets (plants, logistics, IT, licenses).

Capex intensity vs industry maturity.

Replacement vs growth capex ratio.

Depreciation schedules and asset-turnover benchmarks.

Operating leverage and break-even dynamics.

6. Labor and Productivity

Labor share of total cost.

Skill composition and automation potential.

Productivity metrics (output / employee, revenue / FTE).

Unionization, labor regulation, and cost rigidity.

Impact of talent scarcity or migration.

7. Technology and Process Design

Core technologies enabling efficiency.

Data infrastructure, automation, and integration levels.

IT or platform spend as % of revenue.

Innovation cycles and upgrade costs.

Examples of process redesign that changed margins or speed.

8. Regulatory and Operational Constraints

Mandatory compliance processes (safety, data, ESG, quality).

Effect on throughput, cost, and scalability.

Licensing or certification bottlenecks.

Regional operational differences due to policy.

9. Risk and Resilience Mechanisms

Supply, energy, and logistics exposure.

Single-point-of-failure analysis.

Inventory or redundancy strategies.

Sensitivity to macro variables (rate, FX, commodity, demand).

Historical examples of disruption and recovery.

10. Performance Metrics and Benchmarks

Core KPIs: margin chain (gross → EBIT → FCF), ROCE, asset-turnover, cash conversion, utilization, churn, downtime, yield.

Industry-specific ratios (e.g., loss ratio, load factor, throughput).

Median vs top-quartile values.

Operating metrics most correlated with long-term value creation.

11. Operational Best Practices

Methods consistently used by leaders to keep cost, quality, and speed superior.

Lean, automation, network optimization, procurement discipline, or dynamic pricing.

Quantify their effect on margin or ROCE uplift.

12. Investor Implications

Leading indicators of operational efficiency or stress.

Which metrics precede profit warnings or upgrades.

How operating leverage translates into valuation swings.

Checklist for evaluating operators in this sector.
Run all of them in Gemini Deep Research.
Run each prompt one by one: History, Growth & Future, and Operations & Economics.
Export each report as a PDF once Gemini finishes the deep research.
Create a new notebook in NotebookLM.
Import the three PDFs as your first core sources.
Now you’ve got a solid analyst in training, but we’ll keep improving it with more sources next.
Step 3: Add the Industry Leaders
Now import the annual reports into your assistant.
But what if you’re new to an industry and not sure which companies to start with?
Use this prompt, ChatGPT will list the top players:
List 5-7 public companies whose annual reports best represent the [Industry Name] value chain.

For each, include:

Name + Ticker + Country

Role in value chain

Why it matters (scale, specialization, region, or disclosure depth)

Key metrics disclosed

Then add:

A brief value chain summary (how the selected firms cover the full system).

The selection criteria, using:

Publicly listed with full, detailed annual reports.

Clear business explanations in filings (strategy, segments, revenue drivers).

Covers all major steps of the value chain.

Mix of global leader, regional player, and niche specialist.

Strong KPI disclosure (sales, margin, unit economics, growth).

At least 5 years of consistent data.
Import the PDFs of the annual reports into NotebookLM.
Now your assistant doesn’t just understand the industry.
It knows the biggest players inside out.
Add a few expert reports too they sharpen its edge.
Next step: start exploring your new assistant.
Ask it questions.
Challenge it.
See what it really knows.
Step 4: Talk to Your Customized Analyst
Customize your assistant so it answers in the style you like.
Maybe you prefer short summaries, deep analysis, or a conversational tone.
Set that once and every answer will sound like it was written just for you.
Act as my industry analyst.
You will receive questions about this industry, specific companies, or recent developments.
Use the uploaded sources to explain for an investor the key economic drivers, business models, capital intensity, competitive forces, and key metrics from an investor’s perspective, with numbers, examples, and page citations.
When possible, present your answers in bullet points for clarity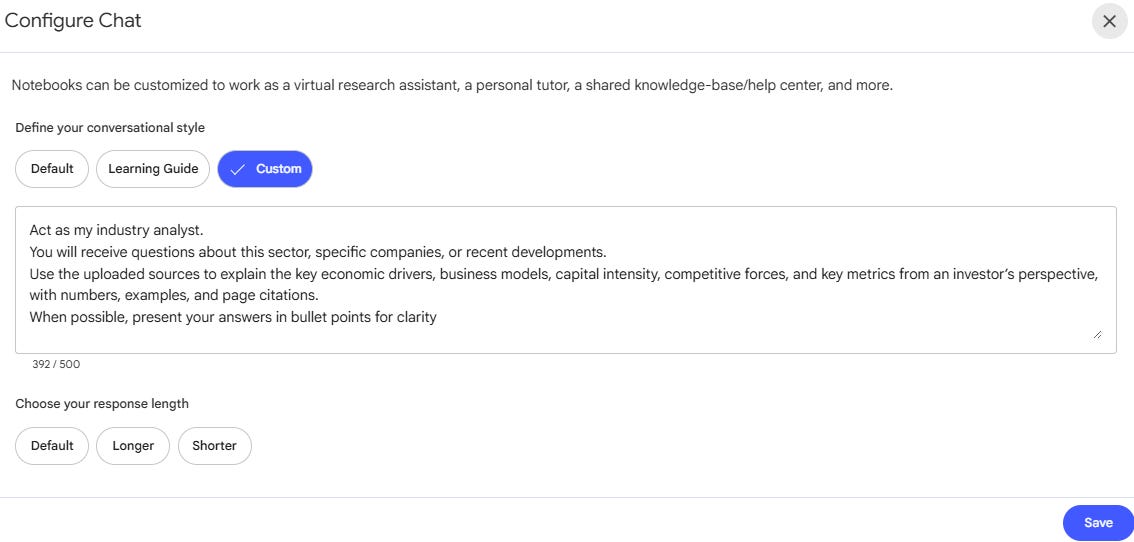
Now you’re ready to chat with your free expert assistant.
I use four types of questions to get the most out of it :
Broad questions : to understand the big picture.
Example: “Explain the growth drivers for each segment in the industry.”
Specific questions : to dig into one company or metric.
Example: “Why did Adyen grow faster than the others in last X Years?”
Hyper-specific questions : to test how the industry reacts to real conditions.
Example: “Does high inflation help or hurt this industry?”
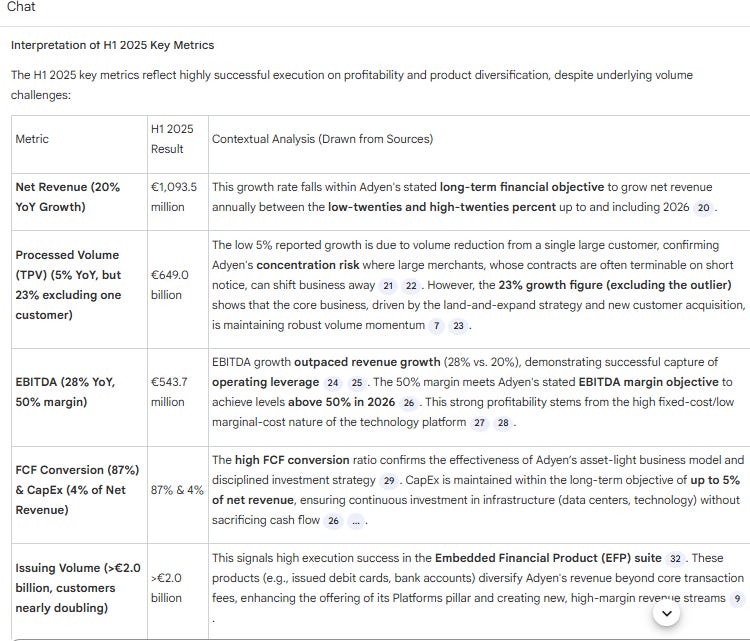
Quarterly results questions :
When I’m new to an industry and a company releases new data, I just upload it into NotebookLM and ask it to explain the results in the context of the broader industry so I can see not just what changed, but why it matters
Example: “Here are Adyen’s Q3 results. Based on what you know about the company and the industry, explain what these numbers mean — especially the changes in margins, growth, and guidance.”
Step 5: Keep Training Your Analyst
Every time you find something interesting ,a new report, podcast, or company add it to your notes as a new source.
Over time, you’ll build a personal assistant that grows with you.
Sometimes you’ll use it daily while you’re deep in an industry.
Other times you’ll come back to it once a week just to stay sharp.
You can use it in countless ways.
In addition to direct questions and business updates, you can also:
Create a podcast focused on one part of the industry.
Generate quizzes on specific topics to test your understanding.
Build short summaries or insights to share with your audience.
Track trends and keep notes organized across companies.
Recap
Identify your sources : pick annual reports, Deep Research summaries, and expert papers.
Create your 3 core reports in Gemini Deep Research : history, growth, and operations.
Add the industry leaders :import annual reports and expert papers into NotebookLM.
Talk to your customized analyst : ask broad, specific, hyper-focused, and quarterly results questions.
Keep training your analyst : add new reports, podcasts, and insights as you learn.
Congrats! You’ve just built a free, always-on analyst that compounds your knowledge and makes you smarter every time you use it.
Upcoming Workshop
PS: I’m teaching a paid, 90-minute live session on how to use Gemini to understand any business 10X faster.
Everyone learns together, step-by-step, in real time.
Join the waitlist to get early access. Limited to 10 people for a truly interactive experience.
Your Free Gift: A Ready-to-Use Payments Analyst:
I’ve just shown you how to build your own industry analyst.
But because I actually want you to use it, I made one for you.
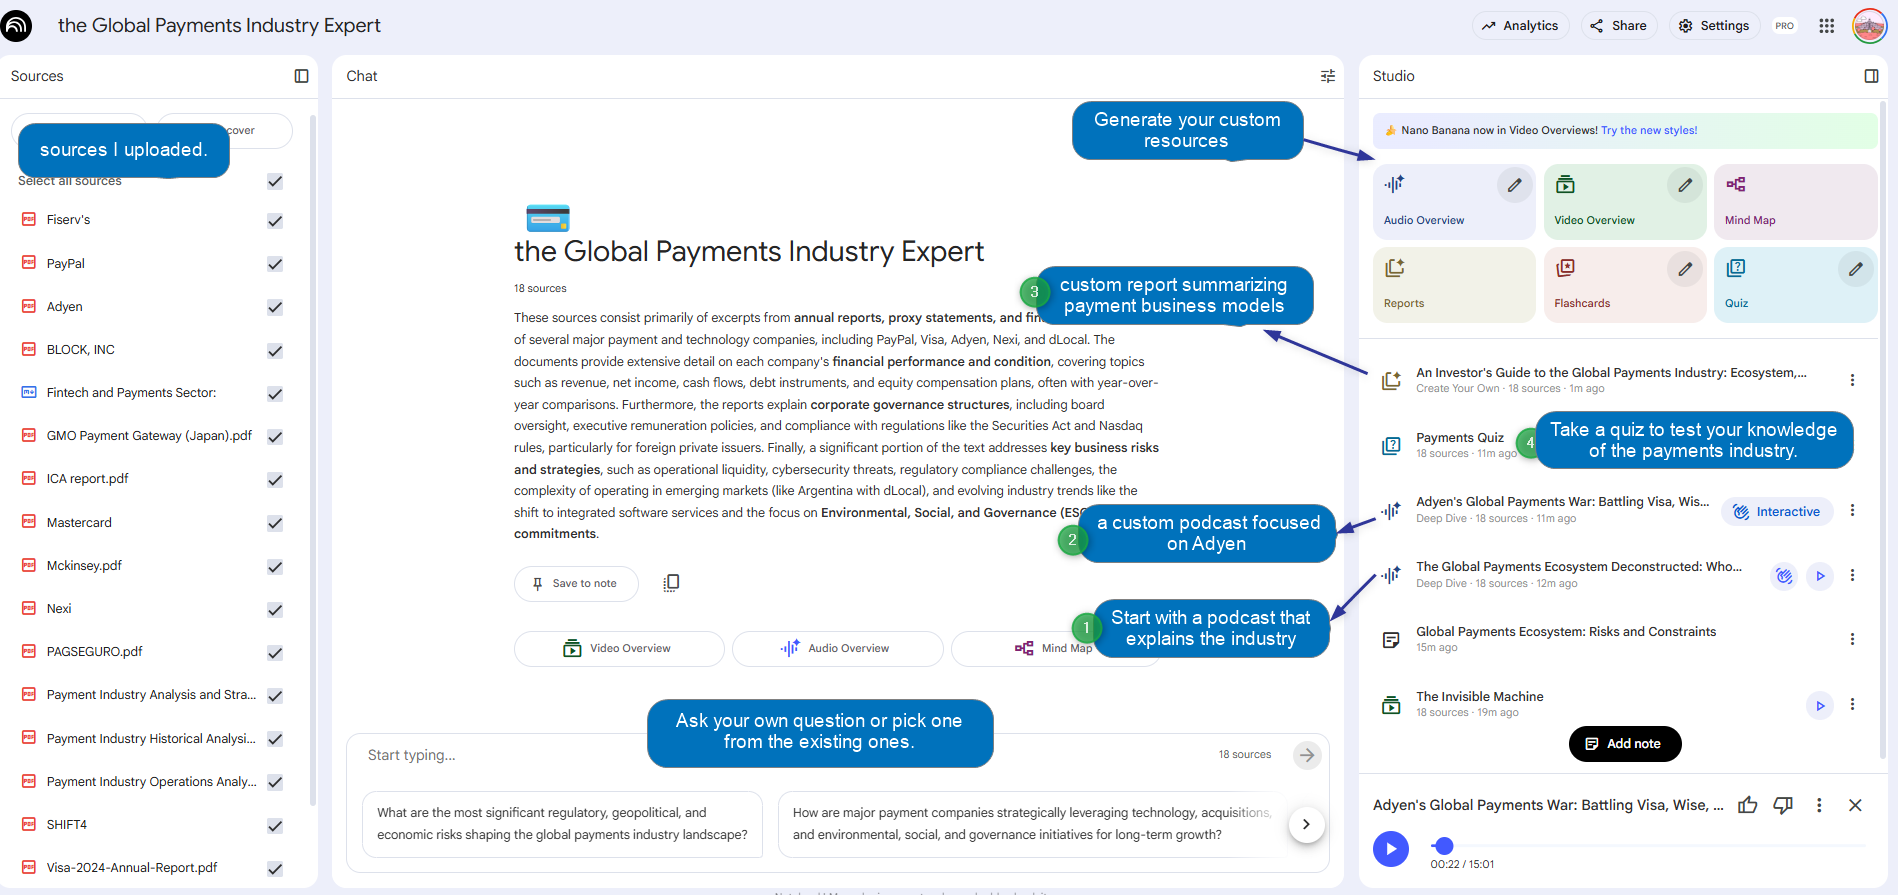
As a free gift, you’ll get a ready-to-use Payments Industry Notebook that already includes:
Auto-generated business reports that explain how the industry works.
A podcast on the fundamentals to get you up to speed fast.
An Adyen deep-dive podcast for a company-level view.
A custom quiz to test your understanding of the payments space.
Use it to explore, ask questions, and see what it’s like to have your own AI analyst at work.
👉 Payments Industry Notebook Gift
Please don’t modify or delete any sources or notes.
This notebook is public and meant for shared learning with unrestricted access.
If anything gets deleted, I can’t restore it, so please explore but don’t edit or remove files.
Love seeing people build practical analyst workflows instead of hype demos. This is the direction research is heading.
If you want to use LLMs in your investment research, this is a great place to start.