
Stop Looking at ROIC. Start Understanding It.
3 Steps process with AI

ROIC is the #1 predictor of long-term stock returns.
Every serious investor knows this.
But first, what is ROIC?
In plain English: how much operating profit a business generates from every dollar invested.
Invest $100.
Get $15 back.
ROIC = 15%. That’s it
The textbook logic:
High ROIC = good business.
Low ROIC = bad business.
Simple..but wrong.
ROIC is never a fixed number.
A cyclical business can show 25% ROIC at the top of the cycle and 5% at the bottom.
A growing business can show low ROIC today but high ROIC once investments mature.
The number alone tells you nothing.
What matters is :
Do you understand why ROIC is high?
Is it sustainable or temporary?
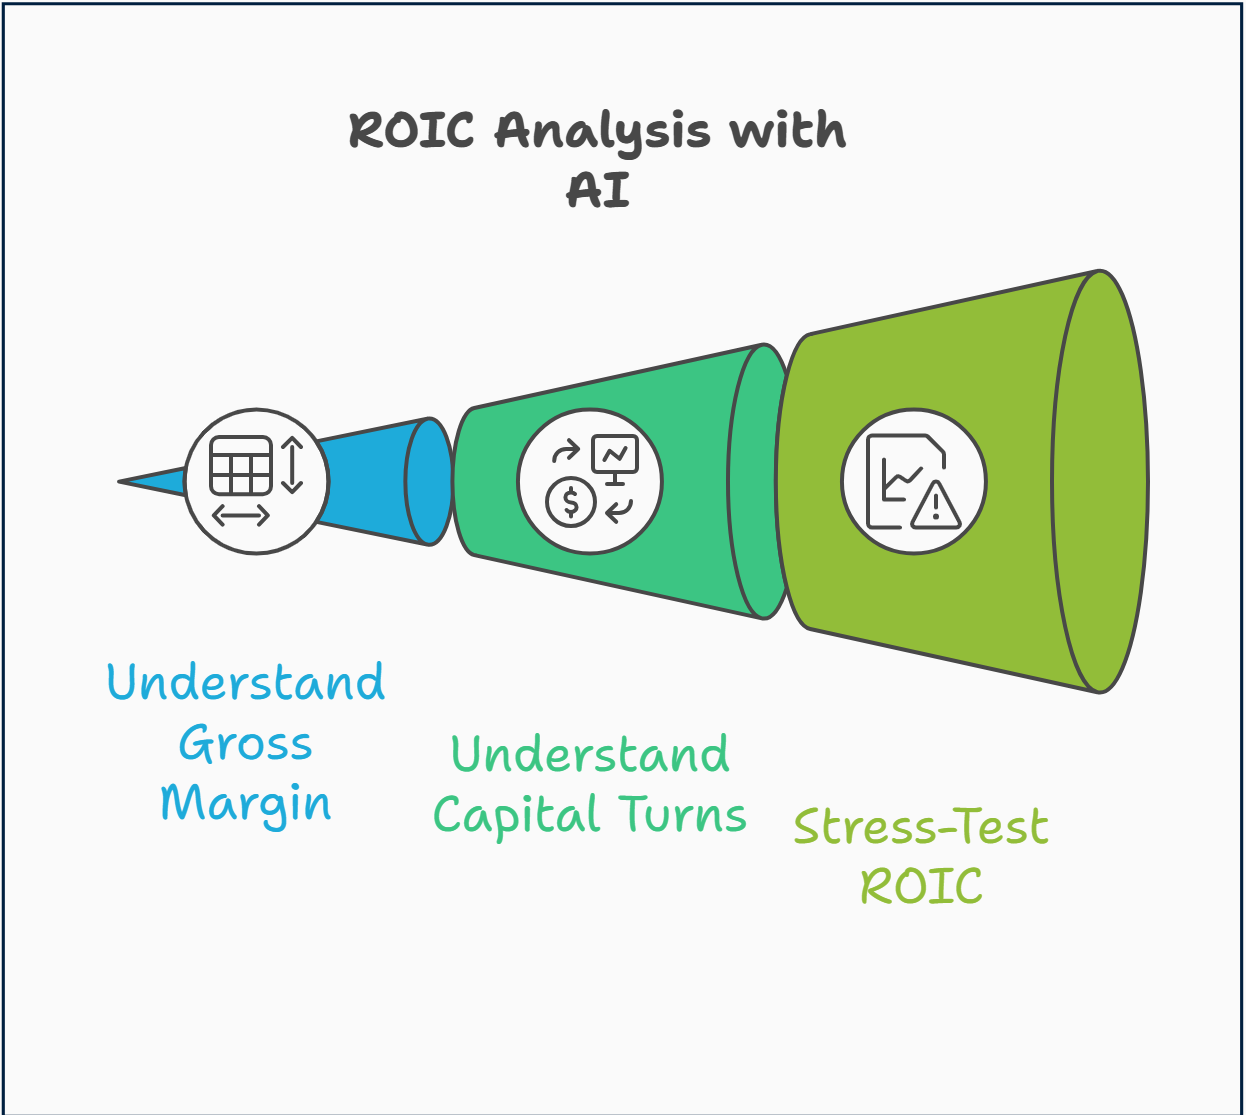
Here’s the 3-step process to find out that with AI :
Step 1: understand what drivers gross margins level
Step 2: Understand the capital turns,and what drives asset efficiency?
Step 3: Stress-test the ROIC, what would make it collapse?
The Two Engines Behind ROIC
ROIC doesn’t appear out of nowhere.
It’s built from 2 forces:
Gross Margin : What’s left from each sale after paying to make the product
Capital Turns : How efficiently you use your assets to generate sales
The “High Margin” Path
A luxury watchmaker (like Rolex)
They might only sell a few items, but the Gross Margin is massive (e.g., 80%).
The Math: If your margin is 40% and you only turn your capital over 0.5x a year, your ROIC is 20%.
The “High Turnover” Path
A grocery store (like Costco) or a gas station.
They have tiny profit margins (sometimes only 2-3%). However, they sell their entire inventory every few days.
The Math: If your margin is only 4% but you turn your capital over 5x a year, your ROIC is also 20%.
Why this matters:
If you don’t know which engine is driving ROIC, you can’t know what would break it.
Step 1: The Gross Margin Reality Check
We want to answer this question; :
Why is this company allowed to keep $0.70 of every dollar it makes?
Why don’t competitors simply lower prices and take its customers?
Run this prompt that will analyze 100+ sources to answer these questions:
Is the margin protected by customer behavior?
Is it temporary cost advantage? (fragile)
Is it linked to industry structure?
Run this prompt in Deep Research mode:
Role
You are an industry expert long-term investor.
Your job
Decide whether INSERT COMPANY HERE gross margin is high or not, and whether it is structural or temporary.
Objective
Conduct a “Gross Margin Reality Check” covering at least the last 10 years (if available). You must determine if the Gross Margin is a structural fortress or a temporary anomaly.
Your entire conclusion must focus exclusively on gross margin mechanics and durability.
10-K, 10-Q (specifically the MD&A, Risk Factors, and Segment Data) and official filings
Earnings call transcripts and Investor Day strategy decks
Industry reports and competitor disclosures (use the latest data to explain recent changes and context)
Integrity: Mark any non-factual analysis as (inferred). Avoid marketing adjectives.
REPORT STRUCTURE & REQUIREMENTS
I. EXECUTIVE SUMMARY
The Current State: A statistical summary of the 10- to 5-year gross margin trend
The “Money Engine”: A one-sentence explanation of the specific “physics” of how the business model turns into gross margin
Industry vs. Individual: Is gross margin high in this industry, and why? Is this margin an industry standard (sector luck) or individual alpha (company genius)?
The Strategic Verdict: Does this margin represent a “Price Boss” (value-based) or an “Efficiency King” (cost-based)?
II. PART 1: THE QUANTITATIVE ANATOMY (THE “HOW”)
COGS Deconstruction: Identify the top 3 direct costs inside Cost of Goods Sold (e.g., raw materials, labor, depreciation)
The Value Driver: Is the margin driven by high ASP (Average Selling Price) or a structural unit cost advantage (patents, process edge, scale)?
Incremental Margin Analysis: Did gross margin % expand or contract as revenue grew over the last 5 years? (Diagnostic of operating leverage)
III. PART 2: THE QUALITATIVE “WAY BEHIND” (THE “WHY”)
The Mission-Critical Test: Is the product a small cost but high risk if it fails? Quantify the customer’s “cost of failure”
The Switching Barrier: Quantify the “pain” of a customer moving to a competitor (data loss, retraining, loss of long-term reliability)
The “Clone” Question: If a billionaire rival spent $1B today, what specific asset (patent, brand, technical secret, distribution, regulatory moat) would stop them from matching this gross margin?
IV. PART 3: THE PRICING POWER STRESS TEST (THE 5-YEAR AUDIT)
Inflation Pass-Through (2021–2024): Did the company raise prices ahead of cost increases? Analyze the speed of margin recovery
Elasticity Proof: When prices rose, did unit volume drop significantly, or was demand relatively inelastic?
FINAL SCORES & VERDICT (GROSS MARGIN ONLY)
Gross Margin Quality Score (1–10):
How structurally strong the gross margin is (brand power, differentiation, structural cost advantage)
Gross Margin Durability Score (1–10):
Likelihood that the current gross margin level persists over the next 5 years under realistic competitive pressure
Final Classification (choose one):
Structural Fortress — Gross margin is structurally protected and defensible
Cyclical / Temporary — Gross margin inflated by short-term factors (pricing cycle, supply chain, fashion trend, FX, etc.)
Structurally Weak — No evidence of durable gross margin advantage
Final Verdict
Must answer only this question:
Is the gross margin structurally high, or temporarily elevated?
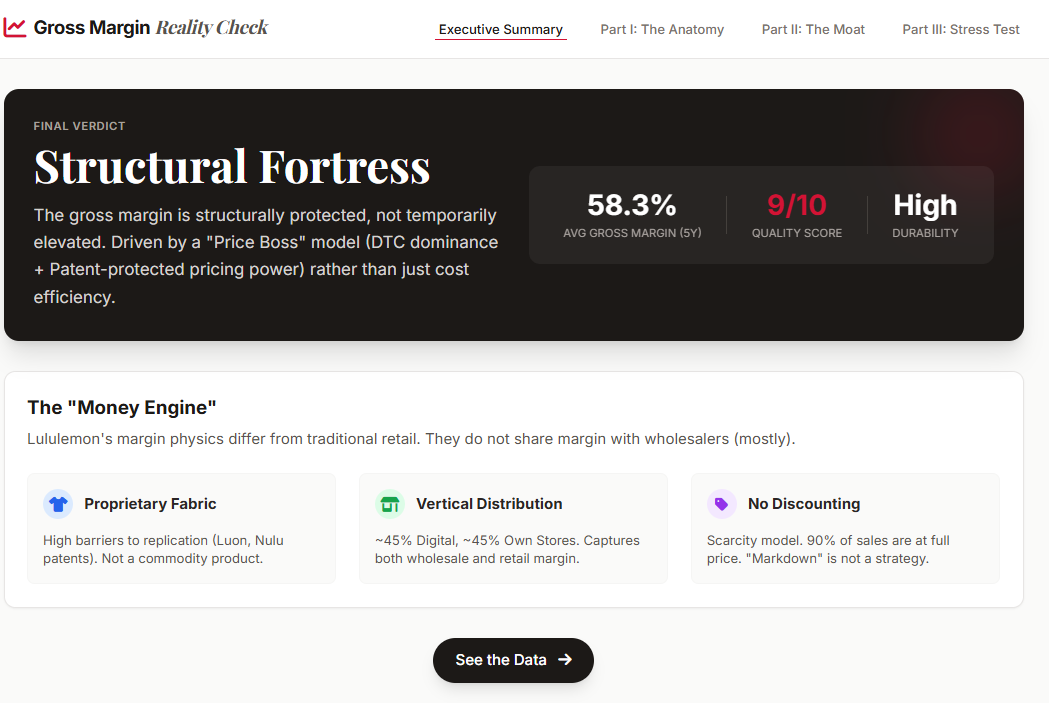
No commentary on valuation, ROIC, management quality, or overall business attractiveness.I did run an example for Lululemon Athletica Inc.
The result is a detailed 14-page report that you can export into a PDF file to deeply understand their gross margin mechanisms.
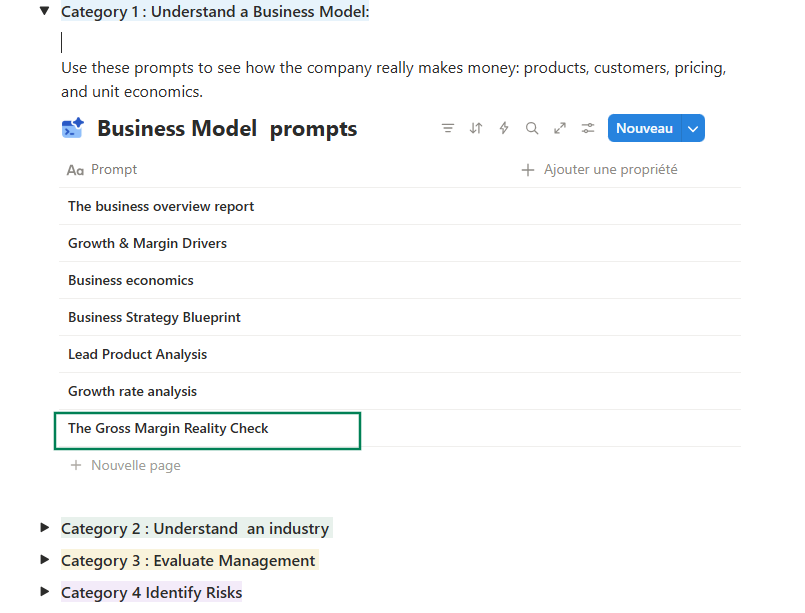
Note: I’ve added this prompt to the Prompt Library, so you can copy-paste it anytime and use it.
Step 2: Capital Efficiency Check
Once you understand why high margins exist, the next question is:
How efficiently does this business turn capital into sales?
What you’re trying to understand?
Not the formula.
The drivers :
1)Asset intensity : How Heavy Is the Business?
Does the company have to reinvest most of its cash just to maintain operations?
Where is the capital actually tied up?
Inventory? Stores? Data centers?
2) Working Capital : Who Funds Whom?
Does the company pay suppliers after collecting from customers?
Do customers pay before delivery, at delivery, or long after?
Does inventory move in days or sit for months?
Run this prompt in Deep Research mode to have all answers: