The 20-Minute AI Workflow to Understand Complex Businesses
A simple challenge turned into a repeatable playbook
Hello, Fellow Stock Pickers
Yesterday
asked on Substack: “Any great primer on the stock-exchange industry?”I didn’t know the industry, so I gave myself a challenge: learn it quickly, make something useful, and show the exact steps I used with AI.
The usual way takes a whole weekend.
With AI, I cut it to 20 minutes…
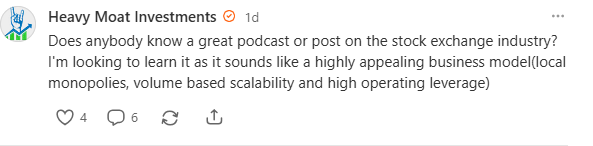
I ran the process on the stock exchange sector. Here’s the playbook you can copy:
Step 1: Learn How the Industry Works
First thing I always do is to get an idea of the industry before I look at a single company.
Here’s where AI makes life easier.
A DeepSearch function in an LLM (I prefer Gemini) is great for pulling reports, summarizing, and explaining the basics.
Yes, sometimes it may get some numbers wrong… but at this stage that doesn’t matter. The point is to build context fast.
What I ask for :
I explain what I want to understand.
I set boundaries on where to search (filings, regulators…)
I tell the model the exact format I want the output in.
Here’s the exact prompt I use:
ROLE
Senior equity analyst. Produce a €10k-grade sector dossier. No speculation. Zero hallucinations. All facts verifiable via high-quality sources.
INPUT
{SECTOR_NAME} for example stock exchange industry
OBJECTIVE
Go from zero to expert on {SECTOR_NAME}: revenue model, growth drivers, cost/margins, constraints, regulation, comps, risks. Deliver a 1-page executive summary + full report with charts and compact data tables.
SOURCE POLICY (STRICT)
Priority A→E:
A) Primary filings & IR (10-K/20-F/URD/S-1, audited IFRS/GAAP, investor days, official transcripts via EDGAR/ESMA/SEDAR+/etc.)
B) Regulators/statistics/multilaterals (SEC, ESMA, OECD, IMF, BIS, IEA/IRENA, ITU, national stats offices)
C) Trade associations with transparent methods
D) Tier-one journals/consultancies disclosing primary data
E) Official exchanges/data vendors (WFE, ICE, LME, S&P Global, Refinitiv) with methodology
Disallowed: SEO blogs, AI-generated pages, anonymous posts, vendor marketing without data, unsourced market sizes, Wikipedia for facts.
RETRIEVAL GUARDS
- Recency bias ≤24 months; older “Legacy” items only if seminal.
- Prefer {REGION}; else Global with regional splits.
- De-dupe. Use latest amended versions.
- If evidence missing: write “Insufficient high-quality evidence” + TODO.
NUMERIC FACT-CHECK PROTOCOL (MANDATORY)
Before outputting any number:
1) Record value, unit, period.
2) Verify against ≥2 independent A–D sources. If not possible, label “Single-source (Low confidence)”.
3) Run sanity checks: order-of-magnitude vs peers/sector; unit conversions correct; time period consistent.
4) If conflict >5%, state both figures, sources, and reason for variance.
5) If uncertain: do not estimate. Mark “Unknown”.
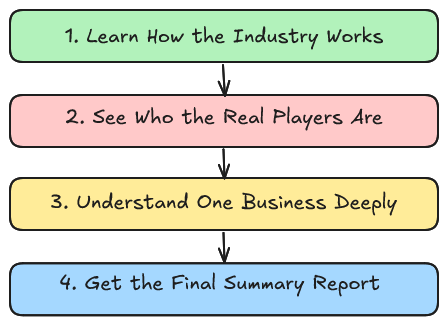
DEFINITION FIRST
- Define {SECTOR_NAME}, subsegments, value chain, buyer types.
- Map to NAICS/NACE/ICB/GICS; list synonyms and boundary cases.
- If ambiguous, present options, select consensus definition, justify briefly.
SEARCH PLAN (EXECUTE)
- Boolean queries with synonyms, codes, “site:” filters for A–E.
- Pull filings of top players; regulator rulebooks; trade-body yearbooks.
SOURCE LIST (COMPACT)
- Cap at 10–15 core sources.
- Present as a simple table (Title | Org | Type A–E | Date | Region | Link | Confidence High/Med/Low).
- No JSON. No page-by-page dump.
ANALYTICAL FRAMEWORK
5.1 Revenue model
- Who pays, why; pricing archetypes; sales motion; contract terms; switching costs; seasonality.
- Unit economics: ARPU/volume/utilization/churn; key sensitivities.
5.2 Growth drivers
- Structural vs cyclical; adoption curves; penetration vs TAM/SAM/SOM with defendable numbers.
- 5–10y scenarios with explicit assumptions and a simple tornado/sensitivity.
5.3 Cost structure & margins
- COGS vs Opex (labor, inputs, infra, compliance).
- Margin stack: Gross→EBITDA→EBIT→FCF; operating-leverage drivers; historical shifts.
5.4 Constraints to scale/margin expansion
- Technical bottlenecks, capex intensity, WC needs, supply chain, distribution, CAC, standards/interoperability, talent.
5.5 Regulation & exogenous factors
- Licenses; data/privacy/safety; environmental rules; trade/tariffs; upcoming proposals and likely timing/impact.
5.6 Benchmarks (peers)
- Table of 5–10 companies: model archetype, geography, revenue mix, margin range, capex %, FCF conversion, ROCE/ROIC, leverage.
- Cite latest audited period.
5.7 Risk register
- 8–12 risks with likelihood/impact, leading indicators, mitigants.
VISUALS
- Include clean CSV-ready tables used for each figure.
- Required figures: value chain map; revenue model schematic; cost stack + margin bridge; market size/penetration over time; scenario tornado.
- No code blocks unless asked. Keep charts reproducible from provided tables.
OUTPUT FORMAT
Page 1 — Executive Summary (≤300 words):
- What the sector sells, who pays, why now
- 3–5 growth drivers
- Margin outlook
- 3 key risks
- List of figures
Main Report:
- Sections 5.1–5.7. Use minimal in-text footnotes like [1], [2] linking to the Source List.
Appendices:
- A) Source List table (10–15 items, links only)
- B) Glossary
- C) Assumptions & Methods
- D) Data tables (CSV-ready)
QUALITY BAR
- Zero unsupported claims. Prefer “Unknown” over guessing.
- Show data vintage and units; convert to {CURRENCY} if provided; add FX note/date.
- Tag each section with Confidence High/Med/Low + one-line rationale.
- End with “Next Research Steps” to close evidence gaps.
BEGIN
1) Sector definition, subsegments, code mappings with 2–3 top sources.
2) Source List table (max 15).
3) Executive Summary, then full report using the fact-check protocol.
The result is usually a 20+ page detailed report.
Don’t read it all now. Just keep it.
What matters at this stage is the one-page executive summary.
The big report will become useful later when we tie everything together in Step 4.
Step 2: See Who the Real Players Are
After you understand how the industry works, the next step is : who are the main players, and how do they compete?
This is where investors often get lost.
They know the names :LSEG, Deutsche Börse, Euronext, ICE, Nasdaq…
In reality, exchanges don’t compete “in general.” They compete in lanes.
Some dominate cash trading (auctions, lit markets).
Others make most of their money in clearing.
Others are really data and index businesses disguised as exchanges.
If you don’t separate them and compare , you’ll miss why margins, growth, and moats look so different from one operator to another.
That’s why in this step I use a prompt to:
Map the players by lane (cash, derivatives, data/IP, clearing, etc.).
Explain why customers choose them (liquidity, fees, speed, brand, regulation).
Highlight differentiation and moats (network effects, index tie-ins, CCP benefits).
Show switching costs (why issuers, brokers, and asset managers don’t easily move).
Here’s the prompt I use:
ROLE
Market-structure analyst for long-term investors. Produce an investor-grade, qualitative-first dossier. Facts must be traceable and cross-verified. If evidence is weak, say so.
INPUTS
sector is stock exchanges
OBJECTIVE
Identify public and private players. Define true peers per lane. Explain customer choice, differentiation, moats, switching frictions, and regime effects. Deliver a 1-page exec overview + full analysis with compact tables.
ENFORCEMENT RULES (NO GUESSING)
- Source bounds: use only A–D. If none available, write “Insufficient evidence.”
A) Primary filings/IR (10-K/20-F/URD/S-1, audited IFRS/GAAP, investor days, official transcripts via EDGAR/ESMA/SEDAR+)
B) Regulators/statistics (SEC, ESMA, FCA, ASIC, WFE/FESE, BIS/IMF/OECD, CCP/CSD rulebooks, national stats)
C) Official fee schedules, market-data licenses, auction specs, MIC/LEI registries
D) Tier-one journals/consultancies with disclosed primary data; major data vendors with methods (S&P Global, Refinitiv, ICE, LME)
- Verification: any figure must be checked against ≥2 independent A–C sources; else tag “single-source (low confidence).”
- Uncertainty: if unsure, write “Unknown.” Do not estimate.
- Conflicts: if sources differ >5%, show both, define scope/period, and state likely cause.
- Recency: prefer ≤24 months; older = “Legacy.” De-dupe to latest amended versions.
- Geography: prefer {Region}; else global with regional splits.
- Citations: bracketed footnotes [1], [2] mapped to a compact Source List (≤15 links).
UNIT OF COMPETITION (MANDATORY)
Define peers per lane (e.g., closing-auction share for cash; block/ETF trading; single-stock options; index futures; CCP cross-margining; data/IP licensing; primary-listing prestige). Group players by lane before comparing.
OUTPUTS
A) Executive Overview (≤300 words).
B) Player Atlas (qualitative) across lanes.
C) Peer Sheet (normalized KPIs) by lane.
D) Moats & Switching analysis.
E) Customer-choice narratives (issuers, brokers/HFT/MMs, buy-side, data buyers).
F) Regime & catalysts.
G) 5–8 item watchlist.
PLAYER ATLAS — FIELDS (QUALITATIVE)
- Legal/brand; ownership (public/private/member-owned); MIC codes; LEI.
- Vertical scope: exchange | CCP | CSD | data | index.
- Regime: RIE/Regulated Market vs MTF/ATS; licenses; passporting.
- Products: listing, lit/auction, dark/MTF/ATS, ETFs, options/futures, clearing model, data/licensing, co-lo/connectivity, index franchises.
- Customers: issuers; brokers/IDBs; HFT/MMs; buy-side; data vendors.
- Why customers choose them: liquidity depth; closing-auction quality; product breadth; latency/tech; reliability; fee/rebate model; index inclusion; issuer services; CCP cross-margining; interoperability; brand/trust.
- Pricing highlights: maker-taker/taker-maker; auction fees; data tiers; co-lo/connectivity; clearing/index fees.
- Market-design specifics: tick-size regime; auctions; volatility interruptions; midpoint/hidden orders; SOR/best-ex implications.
- Competitive stance: local monopoly vs contested; qualitative auction share; vertical silo vs interoperable CCP.
- Moats/frictions: network effects; reference-price status; regulatory entrenchment; IP/data rights; index dependency; issuer transfer hurdles; CCP netting benefits; tech switching costs; accreditation; co-lo ecosystems.
- Vulnerabilities: fee caps; data unbundling; interoperability mandates; tape rollout; latency equalization; outages/cyber; challenger ATS/MTF.
PEER SHEET — NORMALIZED KPIs (PER LANE)
- Mix/returns: revenue mix % (trading/listing/data/clearing/index), EBITDA %, capex % sales, FCF conversion, ROCE/ROIC, net debt/EBITDA.
- Lane metrics: closing-auction share; take rate/contract fees; CCP default-fund size; cross-margin scope; data ARPU; co-lo % sales.
- Through-cycle: 10-year volumes vs volatility; pricing actions; margin resilience; outages/fines.
CUSTOMER-CHOICE NARRATIVES
- Issuers: listing venue selection (index tie-ins, coverage, prestige, fees, cross-listing).
- Brokers/HFT/MMs: order-flow magnets (rebates, latency, stability, queue rules, midpoint/odd-lot handling).
- Asset managers/data buyers: data quality, auction/open-imbalance feeds, entitlement/audit risk, vendor lock-ins.
DIFFERENTIATION & MOATS
- Product edge (derivatives leadership, ETF ecosystem, closing-auction dominance).
- Vertical integration vs interoperability.
- IP/index power; reference-price status; brand/trust; regulatory barriers.
REGIME, M&A, CATALYSTS
- Regime: consolidated tape status; tick-size rules; maker/taker; CCP interop; CSD links.
- M&A/capital allocation (10-year): deals/divestitures; rationale; mix shift; post-deal KPIs; payout policy.
- Catalysts: fee caps; tick-size reform; auction competition; data unbundling; tape rollout; CCP interop; latency equalization; tokenized-assets bridges. Add venue-specific timing + KPIs to watch.
COMPARATIVE MATRICES
1) Venues × Customer-Choice Drivers (liquidity, auction quality, fees/rebates, latency/tech, product breadth, CCP benefits, data/IP, issuer services).
2) Venues × Moats/Frictions (network effects, regulation, index/IP, vertical CCP, tech switching).
3) Lane-based cluster map: true peers vs adjacent.
FORMAT
- 1 page Executive Overview.
- Player Atlas + Peer Sheet.
- Two matrices + short narratives with [#] footnotes to Source List (≤15 links, no JSON dumps).
- Appendices: Assumptions & Methods; CSV-ready tables for any chart.
BEGIN
1) Define lanes and unit of competition; map peers vs non-peers.
2) Build the Player Atlas qualitatively.
3) Populate Peer Sheet KPIs (apply verification rules).
4) Write customer-choice narratives and moat/switching analysis.
5) Add regime, M&A, catalysts, and watchlist.
6) Deliver overview + appendices.
What you get: a clear map of the main exchanges, showing what each one actually competes on.
This is the step where you stop looking at logos and start seeing their real game
Step 3: Understand One Business Deeply
Once you know the players, it’s time to pick one company and go deep.
I chose LSEG (London Stock Exchange Group).
Look at it as if you were buying 100% of the business. That forces you to ask the right questions:
Where does the money really come from?
Which parts are stable, and which are cyclical?
How strong are the moats, and can they last 5–10 years?
What risks could break the model?
This is the exact prompt I did use. It forces the model to do real due diligence instead of spitting out fluff:
Prompt: Comprehensive Business Model Analysis — London Stock Exchange Group (LSEG)
Role: You are a financial analyst preparing a full business model analysis as if acquiring 100% of London Stock Exchange Group. Use only reliable sources: official filings (annual reports, investor presentations, IPO docs), analyst briefings, expert interviews, peer filings, and high-signal industry reports (e.g., McKinsey, Gartner, Yole, BIS, WFE). Avoid speculation or low-signal blogs.
1. Business Understanding
What is LSEG’s exact scope of activity today? (Equities, fixed income, FX, derivatives trading; clearing; index and data services; post-trade settlement; technology solutions.)
Break down its revenue stack:
• Trading services (cash equities, derivatives, FX, fixed income)
• Post-trade (LCH clearing, netting, collateral)
• Data & analytics (FTSE Russell indices, Refinitiv terminal/data feeds, risk analytics)
• Technology and other services.
What core problems does LSEG solve for customers (issuers, investors, banks, asset managers, governments)?
How do typical customers (issuers, fund managers, brokers, banks) buy these services?
Why do they choose LSEG versus Deutsche Börse, Euronext, ICE, Nasdaq, CME?
Revenue model specifics: proportion of recurring (data, indices, subscriptions, connectivity) vs transaction-based (volumes, trading fees).
Gross margin by segment: data vs trading vs clearing.
Is the business cyclical (volume-driven), annuity-like (data), or hybrid?
How integrated are Refinitiv and FTSE Russell within client workflows?
2. Market and Competitive Position
Define the real TAM/SAM:
• Global data and analytics market (Bloomberg, FactSet, S&P Global, MSCI).
• Trading and clearing volumes in Europe.
• Index licensing market.
What secular trends drive LSEG? (Data explosion, passive investing, regulatory push for central clearing, ESG data demand, consolidation among exchanges.)
Competitive dynamics:
• In data/analytics: Bloomberg, FactSet, S&P, MSCI.
• In exchanges/clearing: ICE, Deutsche Börse, Euronext, CME, Nasdaq.
Where does LSEG have structural competitive advantage? (e.g., network effects in clearing, embedded indices, scale economics, data integration with Refinitiv.)
Durability of these moats over 5–10 years.
Threats:
• Big Tech entering financial data.
• Regulatory unbundling of data/indices.
• Consolidated tape in Europe.
• Shift to alternative trading systems or DeFi.
Does LSEG have pricing power in data (like Bloomberg and MSCI)?
3. Financials
Historical revenue, EBIT, FCF trends pre- and post-Refinitiv acquisition.
Segment-level margin trends: trading vs post-trade vs data.
Integration progress of Refinitiv: synergies realized vs promised.
ROCE/ROIC evolution — is capital allocated efficiently?
Free cash flow generation vs debt service (notably after the Refinitiv deal).
Dividend and buyback track record.
Debt profile: maturities, leverage ratios, refinancing risk.
Cyclicality of trading vs resilience of data subscriptions.
Sensitivity of revenues to market volatility and macro cycles.
4. Management and Strategy
Who leads LSEG? Background of CEO and executive team.
Insider/founder ownership vs institutional.
Long-term strategy: integrate Refinitiv, expand data/analytics, ESG products, grow tech solutions.
Historical capital allocation: M&A (Refinitiv, FTSE, Russell), divestitures, organic investment.
Evidence of execution skill in complex integrations (e.g., Refinitiv progress vs plan).
Current strategic priorities: cross-selling data and trading, building global data platform, leveraging AI in analytics.
5. Peer and Comparative Analysis
How does LSEG’s revenue mix and margin profile compare with:
• Deutsche Börse
• Euronext
• ICE (especially ICE Data and ICE Clear)
• Nasdaq (market services + data)
• MSCI and S&P Global (index/data peers).
Which peers are more transaction-driven vs data-driven?
Where does LSEG sit on spectrum: exchange operator vs data vendor vs infrastructure provider?
6. Investor View — Acquisition Lens
If acquiring 100% of LSEG:
• Which divisions provide stable annuity-like cash flows?
• Which divisions are cyclical, volatile, or regulatory-dependent?
• What integration risks remain?
• Where is the hidden upside (pricing power, scale synergies, cross-selling)?
• Where is the hidden downside (data commoditization, regulation, customer concentration)?
What is the long-term reinvestment runway?
Under what scenarios does LSEG compound value at double digits for 10+ years?
Under what scenarios does it stagnate?
7. Sources to Query
Official: LSEG Annual Reports, Capital Markets Day slides, Refinitiv acquisition prospectus.
Competitor filings: Deutsche Börse, ICE, Nasdaq, MSCI, S&P Global.
Industry: BIS clearing reports, WFE annual statistics, McKinsey on financial data.
Expert: Analyst transcripts, industry podcasts, CEO interviews, Stratechery/Seeking Alpha coverage.
Output Expected:
A single structured investor memo, ~1,000 words, clarity-first, no fluff. Each section must specify mechanism (driver → impact → P&L/FCF effect). Use peer comparisons and customer case examples where available. Highlight both bull and bear theses.
Step 4: Get the Final Summary Report
This is the step that makes the first three worth doing.
In Step 1, you learned how the industry works.
In Step 2, you saw who the real players are and how they compete.
In Step 3, you understood one company as if you were buying the whole thing.
Now you take all those outputs, export them as PDFs, and hand them back to the LLM.
The rule is simple: no new data, no random sources. Just use what’s already inside these reports, and cross-check the insights against each other.
Why this matters:
It forces consistency across sector, players, and company.
It highlights contradictions (if Step 1 says X and Step 3 says Y, you’ll see it).
It gives you one synthesis you can actually act on, instead of three scattered documents.
ROLE
You are a senior equity analyst writing for long-term investors.
OBJECTIVE
Produce a qualitative investment report (~2,500–3,000 words) that:
Explains the sector business model and growth drivers.
Analyzes one company within that sector in depth.
Frames both Bull and Bear cases clearly.
Cross-checks insights across all PDFs I provide (do not lift text, synthesize).
Emphasizes mechanisms and strategic logic, not short-term numbers or valuation.
SOURCES
Use only the PDFs I provide (annual reports, investor decks, industry whitepapers).
Always synthesize insights across documents. Never copy/paste.
If a fact is missing, write “unclear.”
No invented numbers.
OUTPUT STRUCTURE
Executive Summary (≤8 bullets)
• What the sector is, why it matters.
• Core growth drivers and risks.
• Main bull vs bear debate.
Sector Deep Dive
• Revenue engines, cost drivers, operating leverage.
• Long-term growth drivers (tech, regulation, demographics).
• Structural moats (network effects, switching costs, regulation).
• Where profit pools concentrate in the value chain.
• Tailwinds vs headwinds over 5–10 years.
Company Deep Dive
• Business model (products, customer base, pricing, moat).
• Margin and unit-economics logic (qualitative if no numbers).
• Management strategy and capital allocation.
• Competitive positioning relative to peers.
• Long-term durability and risks.
Bull Case (4–6 bullets)
• Each = driver → mechanism → cash flow effect.
Bear Case (4–6 bullets)
• Each = risk → why it matters → financial consequence.
Investment Logic for Long-Term Investors
• Why or when this business could compound capital for 5–10 years.
• What could break the thesis.
• Key metrics to monitor.
Conclusion
• Clear stance: who should own or avoid the stock, and why.
STYLE RULES
Synthesize across PDFs, do not quote or copy.
Skimmable, with many bullets.
Use direct causal chains: “X → Y → Z.”
Expand ambiguous points until unambiguous.
Zero fluff, no DCF, no price targets.
What you get: the one report worth reading first.
It ties together all three earlier steps into a single investor memo.
Recap
Step 1: Learn How the Industry Works
Step 2: See Who the Real Players Are
Step 3: Understand One Business Deeply
Step 4: Get the Final Summary Report:
Export Steps 1–3, feed them back into the LLM, and get one investor note to read first.If you want deeper analysis, you can always go back to the detailed reports.
Remember: the goal here isn’t to outsource your thinking. It’s to get a solid understanding of the industry in 20 minutes with my ready-to-use prompts so you can start doing your own work faster.
If you need more depth later, you already know where to dig.
This should answer: “How does the industry work?” Copy-paste the prompt and get the answer in 20 minutes
Many thanks for this, very useful. I see exchanges as good opportunities to invest into some emerging markets or regions outside of the main stream. The business is often really sticky and usually the companies return lots of capital back to shareholders. Makes for a good IRR if bought right, with limited risks due to the local monopoly dynamics that often happen.