Hello, Fellow Stock Pickers
4 years ago, I spent a month buried in shipping reports.
Freight rates, shipbroker notes, obscure terms like VLCCs and scrapping cycles.
That deep dive turned into a 5× return on tanker stocks.
It was a bet on a sector driven by cycles.
this isn’t my main investing strategy.
But when it works, it works big.
But for a generalist investor, the barrier to entry is high.
you need to understand a lot before you even start deeper analysis.
Back then, it took me a full month just to get the sector straight in my head.
I reviewed my notes and turned them into a playbook. A shortcut you can use anytime you tackle a new sector using AI. :
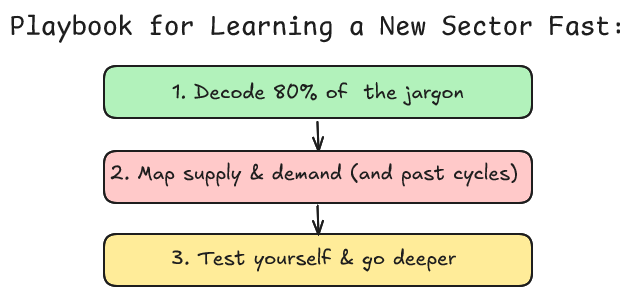
1) Decode the jargon (so you can think clearly)
In any sector, the first barrier is the language.
Good news: 20% of terms explain 80% of what you’ll read.
How to do it (fast) with AI:
Use ChatGPT (Thinking mode) for this step, it’s great at this.
Ask it to:
List 20–25 must-know terms for the sector.
Explain each in plain English (1–2 short lines).
Tie each term to revenue/margins (why it matters).
Give one simple example (numbers if helpful).
Tell you what to watch next (KPI or data source).
Cite a source or write “Data gap: …” instead of guessing.
Or just steal my ready to use prompt :
ROLE: Senior equity analyst + tutor.
INPUT: Sector = [SECTOR]
AUDIENCE: Long-term investor; zero prior knowledge.
OBJECTIVE: Teach the minimal jargon (20–30 terms) that explains 80% of how the sector works and drives returns.
METHOD (Pareto)
- Extract terms from filings/trade language; cluster; reduce to 20–30 “cluster-head” terms (merge synonyms).
- Enforce learning order: Units/actors → capacity/inputs → contracts/pricing → unit economics → capacity/ops → competition → regulation/standards → accounting/valuation.
- Any unavoidable meta-jargon must include a 1–3 word parenthesis (e.g., “indexation (price linked to benchmark)”).
OUTPUT (Markdown ONLY)
A) Core Jargon Table — 20–30 terms; ordered to learn fast
Columns:
- Term
- Plain definition (≤24 words; no nested jargon unless parenthesized)
- Investor relevance (≤28 words; tie to revenue/cost/risk/cash)
- Small numeric example (with units; show 1-step math if non-obvious; label “Example only”)
- Synonyms/variants (note sub-segment/regional variants)
- Tags [Level: Basic/Intermediate/Advanced | Driver | Confidence H/M/L | Region/Segment | Units]
C) Key Formulas & KPIs (5–8 items)
- Begin with a unit legend tailored to [SECTOR] (e.g., $/user/mo, bps, MW, wafers/mo, m³, tons, $/day, ARPU).
- Each line: Formula = … ; Why it matters (≤20 words).
- Use illustrative numbers only; mark them “Example only”.
ANTI-HALLUCINATION (no sources required)
- Do NOT invent terms/ranges or claim “typical” values. If uncertain → “Unknown—needs verification: [what].”
- If definitions differ by sub-segment/region, label in-row: “Ambiguous — Variant A/B (≤24 words each). When used: …”
- Keep units consistent; show calc for any non-obvious example.
- No company-specific claims unless labeled “Company-specific (example only).”
- Prefer plain, widely used terminology; merge synonyms; avoid niche slang.
FORMAT
- Clean, skimmable Markdown; short sentences; active voice.
- Output ONLY sections A and C—nothing else.
- Make it easy for a total beginner to read and retain.
The output looks like a cheat code.
In one table, you suddenly speak the sector’s language.
You’ll need this for the next steps…
2) Map Supply & Demand (and study past cycles)
Once you know the language, the next step is to see what actually moves prices and returns.
Every sector boils down to supply vs demand but only a few forces really matter.
Instead of drowning in 100 reports, go for the 20/80:
The demand drivers that explain most revenue swings.
The supply drivers that explain most margin shifts.
Each tied to a clear indicator you can track.
Use DeepResearch in Gemini (or another LLM) for this step.
What your prompt should force AI to deliver:
Top drivers (3–5 on each side).
Directionality: ↑/↓ → effect on price/margins.
Type: Structural (multi-year), Cyclical (1–3y), or Shock/Policy (sudden).
Past examples: when this driver mattered.
Indicators: what to watch, units, update frequency, sources.
Then, don’t stop at the drivers.
Have AI study the history of booms and busts in the sector:
When cycles flipped.
What triggered the upturns.
What killed returns in the downturns.
How management teams talked before/after the shift.
This gives you a mental model of cycles what creates and destroys returns so you’re not flying blind when history rhymes again.
Steal my tested prompt.
I spent 2 hours building and testing different versions of this prompt on sectors I know well until it consistently gave reliable, usable results.
Take it for free (and if you want more like this, hit subscribe).
ROLE
Senior sector analyst — write a narrative-first Supply & Demand report with exhibits.
INPUTS
Sector: [SECTOR]
Region: [REGION]
GLOBAL
- As-of: today. One currency + unit system. Short sentences.
- Unit legend: [list core units for this sector].
- Narrative first: claim → because → evidence → investor “so-what”, then exhibit.
STRUCTURE (Markdown)
0) Cover — Sector, Region, As-of date.
1) Executive Summary — 80/20 drivers; today’s setup; 3–5 catalysts; watch-metrics (name, unit, freq).
2) Definitions & Scope — boundaries, sub-segments, units/assumptions; mark “Data gap: …” if unknown.
3) DEMAND — Structural / Cyclical / Shock-Policy; for each top driver: mechanism, quantification, indicators (name, unit, freq), lead/lag tag, one-line so-what. (Exhibits D…)
4) SUPPLY — Capacity/utilization, lead-times, builds/orderbook, exits, maintenance, regulation effects; bottlenecks + timing risk. (Exhibits S…)
5) PRICE & CONTRACTS — Spot/Indexed/Fixed (benchmark, venue, tenor, settlement lag); pass-through map (lags/escalators/floors/FX); power by phase (util thresholds); invoice price stack; realized vs spot (mix/hedges/timing); hedge overlay. (Exhibits P…)
6) UNIT ECONOMICS & OPERATING LEVERAGE — unit model, margin stack, throughput; sensitivities on the 3 biggest drivers. (Exhibits U…)
7) ELASTICITIES & SUBSTITUTES — demand elasticity (H/M/L) + triggers; supply elasticity (SR/LR) + lead-time bands; substitute matrix. (Exhibits E…)
8) SCENARIO GRID 2×3 — Demand {Weak/Base/Strong} × Supply {Tight/Normal/Loose}; one line per cell: price direction, margin band, utilization band, confirming indicators. (Exhibit G)
9) INDICATOR DASHBOARD — leading vs coincident/lagging (name, unit, frequency).
10) RISK REGISTER — top risks, mechanism, early-warning indicator, mitigation/hedge.
11) BOOMS & BUSTS — 4–6 past tops/bottoms (years, trigger, pre-conditions, indicators, price/margin path, duration); checklists (Top vs Bottom); tripwire IF/THEN thresholds; “Last cycle vs Now”. (Exhibits B…)
RULES
- Cite material facts; if conflicting, show both and state choice.
- No “typical ranges” without sources. Mark unknowns: “Data gap: …”.
- Merge synonyms; flag ambiguities inline: “Ambiguous — Variant A/B. When used: …”.
- Each exhibit: title, units, as-of date, one-line takeaway.
Believe me, I made real money in tankers, and I tested this prompt across sectors I know well.
It gives you great results fast.
The speed-up you get on a new sector is crazy.
And you can always turn a long Gemini DeepResearch report into a simple, easy-to-digest 1-pager.
3) Test Your Understanding (and go deeper)
At this point, you’ve got a solid base on the sector.
Now you need to pressure-test your knowledge and push it further.
Here’s how to do it:
Start with a quiz in Gemini: answer 10 questions on the sector basics, based on the report you generated earlier.
Pick the biggest companies in the sector and download their latest annual reports.
Alternate between reading the report and asking AI in standard ChatGPT model :
“Explain this section in plain English.”
“What does this KPI mean for margins?”
“How does this tie back to the supply/demand drivers we mapped?”
This way, you move from theory to application.
You don’t just “know the sector” to you can actually read a real business in it.
Recap (The Shortcut I Wish I Had)
4 years ago, I spent 30 days grinding through shipping reports to earn a 5×.
Today, AI compresses that same journey into a weekend.
But let’s be clear: this is not the end of the work.
It’s the first barrier. the point where most investors get lost and never even start learning a new sector.
With this playbook, you break through that wall.
Decode the jargon : 20 terms that unlock 80% of the sector.
Map supply & demand (and past cycles) : see what creates and destroys returns.
Test yourself & go deeper : quiz + annual reports to cement real understanding.
It’s the shift from being stuck at the gate to being ready for the real work.
Most investors never get this far..
Now you can.
I happen to be in tankers, so I right away tried the prompts on crude and product tankers. It works wonderfully. Now trying in in junior mining, my new pet interest. Thank you for this great tool
Hi
Thanks for the great prompts.
I do have 1 question: should I use deepresearch on the second prompt? (I think so)