
The Google AI that makes research feel effortless
5 ways to speed up your research with NotebookLM

If I could use only one AI tool for investing, It would be NotebookLM.
You drop in annual reports, transcripts, ,Youtube video, or even your own notes.
It reads everything, cross-checks the facts, and shows you what matters.
Each answer links straight to its source.
No hallucinations. No guesses.
10 of filings turn into clear insights in minutes.
5 ways to speed up your research with NotebookLM:
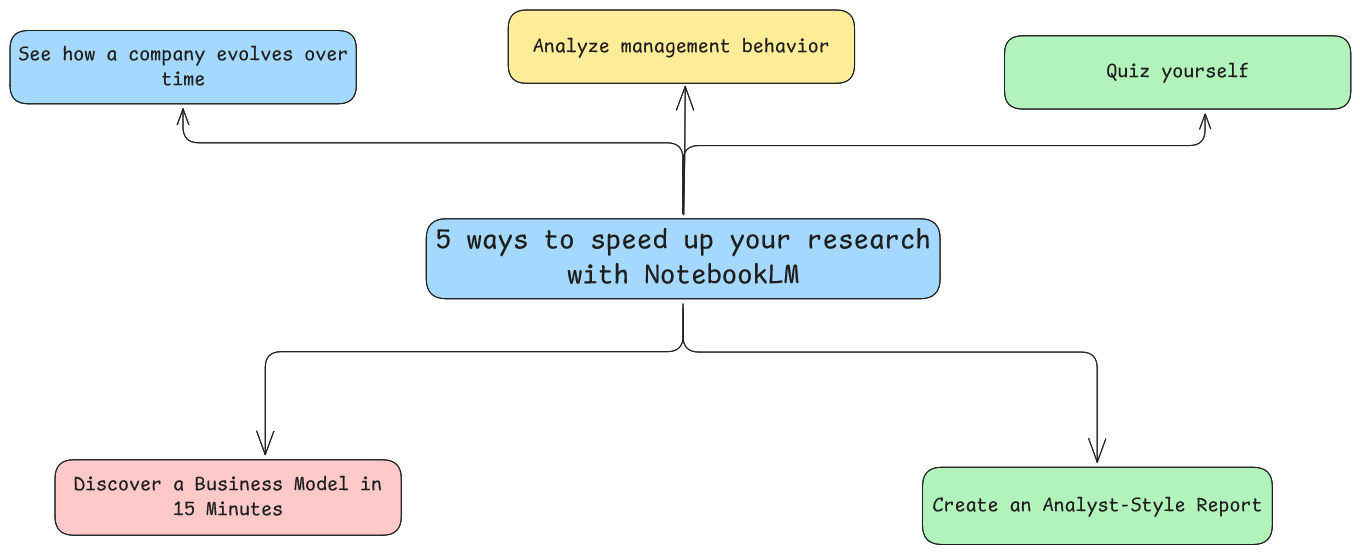
1.Discover a Business Model in 15 Minutes
You want to understand how a business really makes money ?
Here’s how to do it:
Create a new notebook:
Open NotebookLM → click New Notebook → name it after the company (ex: Yubico AB It’s an interesting Swedish ex-darling in cybersecurity, known for its physical authentication keys).
Add your sources:
You can either:
Upload files (annual report, investor deck, transcript, video, etc.)
Or use the Discover Sources function to let NotebookLM find 10 relevant materials automatically.
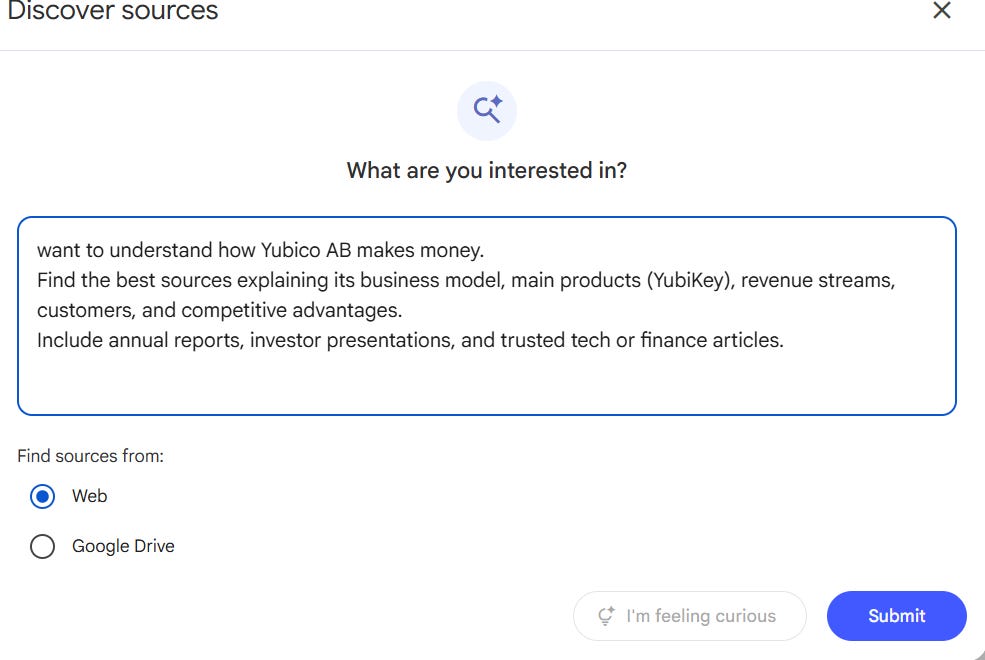

Choose your learning mode:
A video or audio overview : learn while walking or driving.
A summary text : ideal if you prefer to read
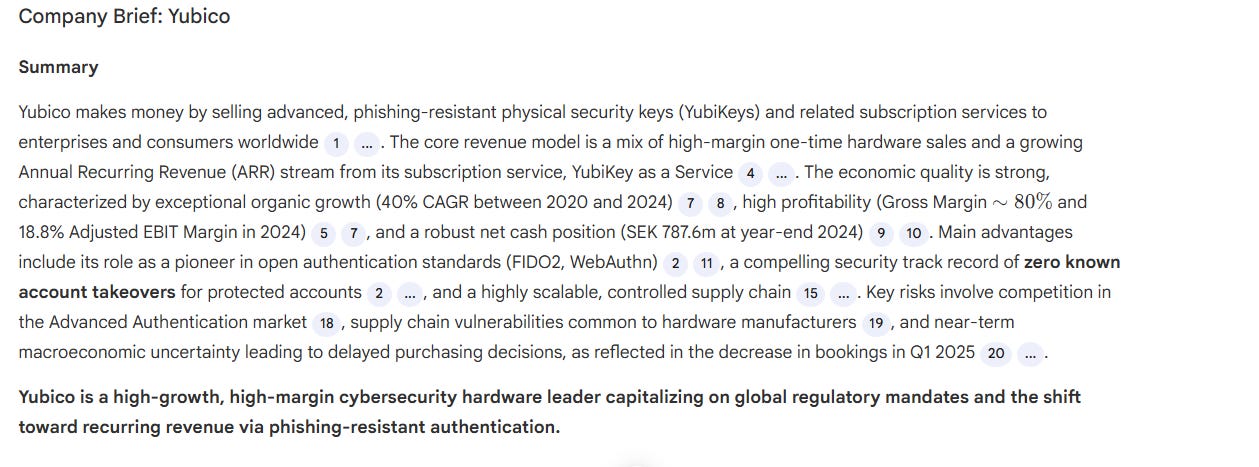
An automatic summary of Yubico by NotebookLM

Ask about the basics:
I always start with a few basics:
“Explain how this company makes money.”
“Who are the customers, and what problem do they pay to solve?”
“Where do the margins come from?”
That’s how you understand a new business model fast.
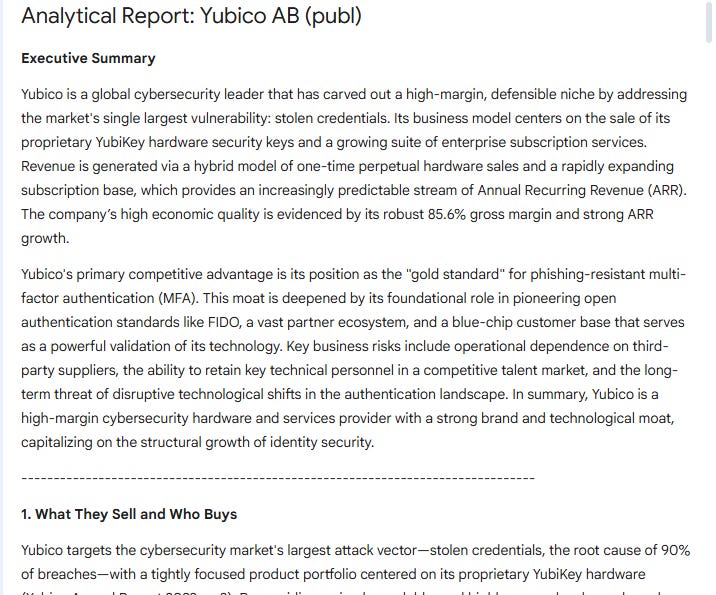
2. Create an Analyst-Style Report
Most investors stop at summaries. That’s a mistake.
NotebookLM can write like an analyst if you teach it how.
Upload your data
Add the last 5 annual reports, investor presentations, and quarterly updates.
The more consistent the data, the cleaner the output.
Open “Create Report”
Click the Custom Report feature inside your notebook.
This tells NotebookLM to synthesize information across all sources.
Give it structure
Most AI automatic reports lack structure.
Use a clear analytical frame that forces NotebookLM to quantify and compare.
Paste this inside the “Instructions” box:
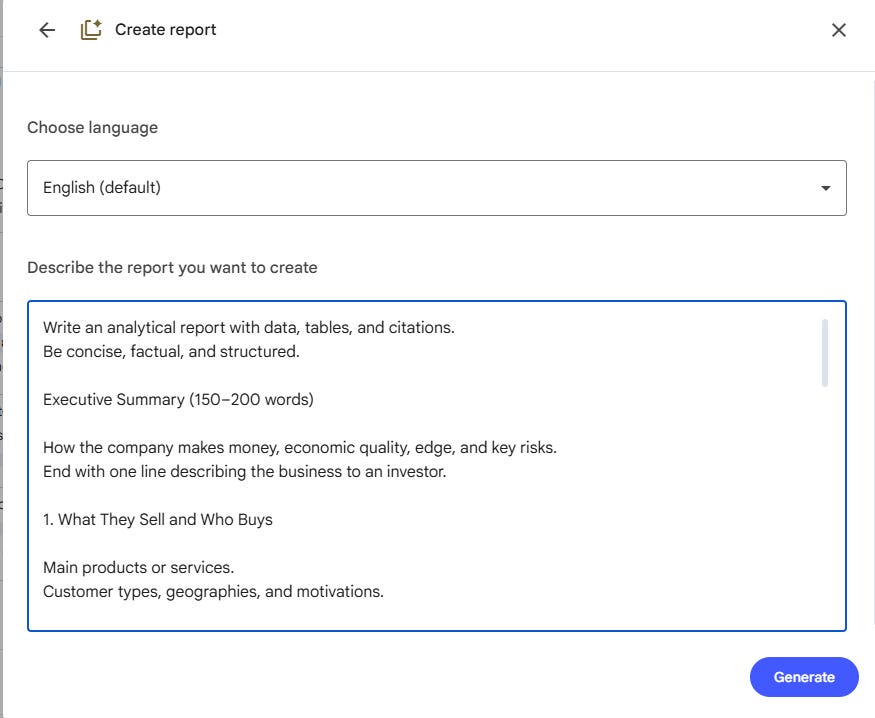
Use this Prompt for a business overview :
Write an analytical report with data, tables, and citations.
Be concise, factual, and structured.

Executive Summary (150–200 words)

How the company makes money, economic quality, edge, and key risks.
End with one line describing the business to an investor.

1. What They Sell and Who Buys

Main products or services.
Customer types, geographies, and motivations.

2. How They Make Money

Revenue model (one-time, recurring, hybrid).
Main segments and % share if available.
Table: Year | Segment | Revenue | % of total

3. Revenue Quality

Predictability and diversification.
Recurring vs one-off, customer concentration, cyclicality.

4. Cost Structure

Main cost drivers (COGS, labor, logistics, etc.).
Margins table: Year | Gross % | EBIT % | EBITDA %
Comment on scalability and leverage.

5. Capital Intensity

Capex, working capital, cash conversion.
Table: Year | Capex | Capex/Rev % | FCF | FCF/Rev %

6. Growth Drivers

Volume, pricing, product mix, expansion, acquisitions.
Label structural or cyclical.

7. Competitive Edge

Moats (brand, cost, data, network, IP, regulation).
Support with ROIC, margins, or retention data.

Tone:
Neutral, numerical, precise.
Use citations. Write “Not disclosed” if missing.

Goal:
Show how the business works
You’ll get a custom report that explains the business clearly:
3. See how a company evolves over time
Once I understand a business model, I want to see how it evolves through time.
That’s where NotebookLM becomes powerful.
Here’s how to do it:
Build your multi-year notebook
Open NotebookLM and create a new notebook.
I keep one for every company I follow.
Upload the last 5-10 annual reports.
NotebookLM reads them all, connects the data across years, and builds context automatically.
Ask for financial data your way
You can shape the output exactly how you want it.
“Give a table with revenue, gross margin, EBIT, and free cash flow for each year.”
Then continue the conversation naturally.
Ask whatever comes to mind:
“When was EBIT negative, and why?”
“What’s the target EBIT margin in the latest outlook?”
“What are the main drivers behind the change?”
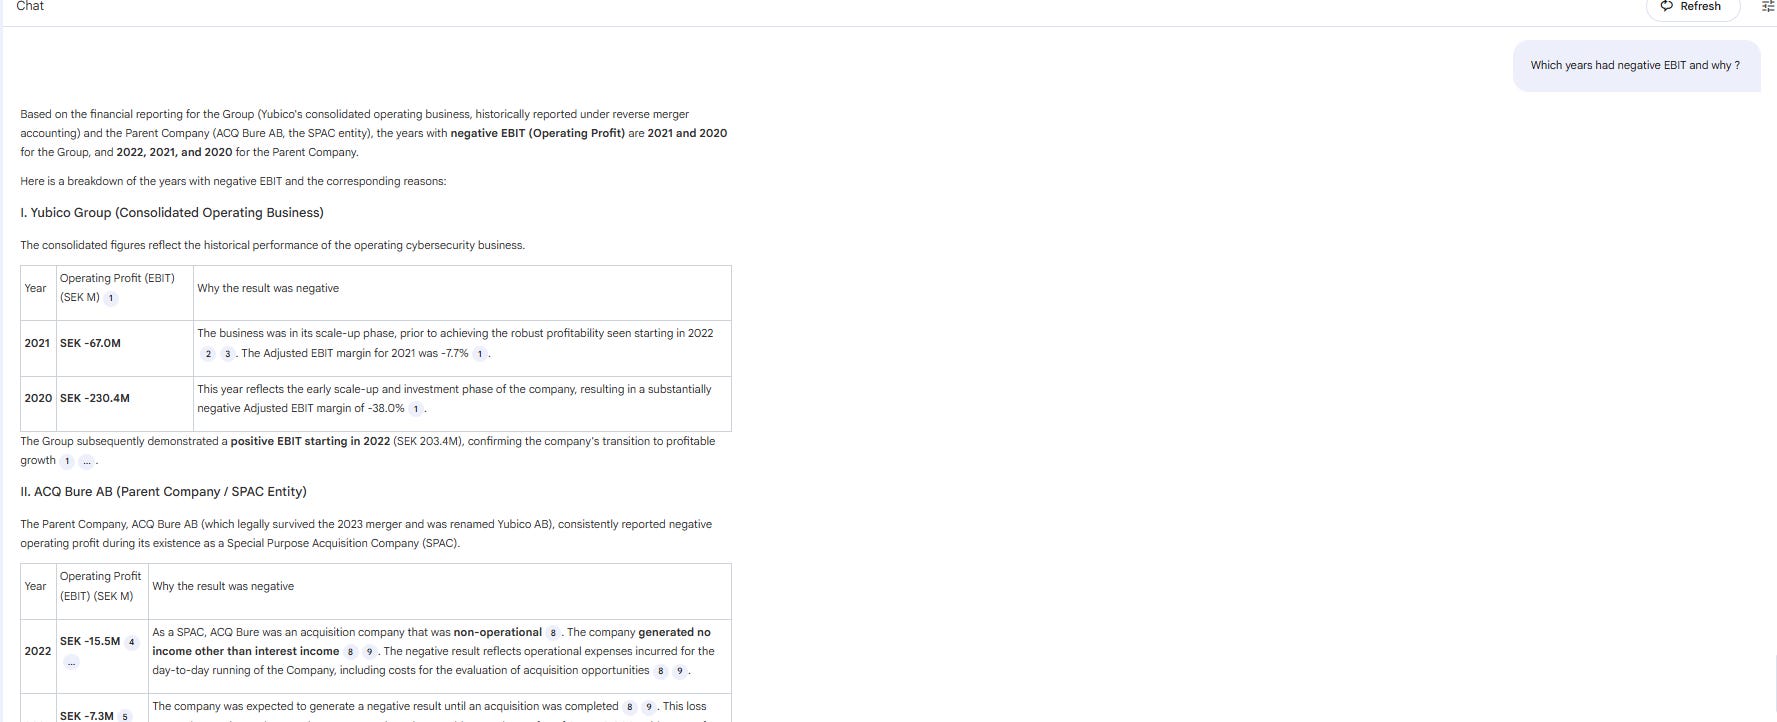
NotebookLM connects each answer directly to the source, so you always know where the number came from.
4. Analyze management behavior
It’s one of my favorite use cases.
Gather what management say
Upload CEO letters, earnings call transcripts, and interviews even YouTube talks or podcasts.
These show how management thinks and what they promise.
Ask focused questions
Start with:
“What goals has management repeated most often?”
“Which promises have been achieved?”
“What topics do they focus on every year?”
“How does the latest outlook compare with what they said two years ago?”
NotebookLM pulls quotes and connects each one to its original source.
Spot consistency and gaps
Look for patterns:
Are priorities changing?
Do words match actions?
Are they more confident or defensive over time?
You’ll quickly see how management really performs — what they focus on, what they forget, and whether their story fits the facts.
5.Quiz yourself
Use NotebookLM to quiz yourself on what you’ve learned:
Ask it to generate a quiz on the company’s business model, growth drivers, or key metrics.
Customize the quiz to focus on what you want to master.
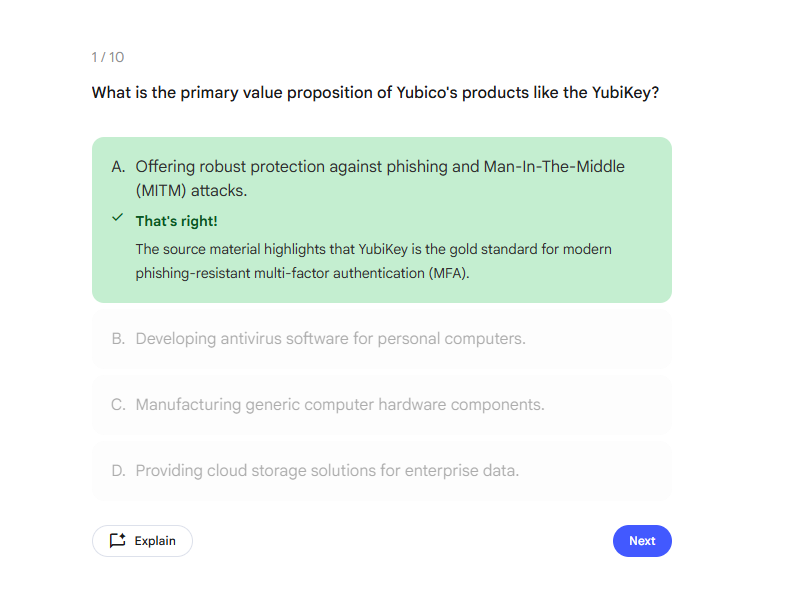
If you don’t understand a question or answer, click Explain he will walk you through it step by step, using your own sources.

Recap:
NotebookLM earns a place in your AI stack.
It helps you:
Read a decade of reports in minutes
Build reports with real numbers
Track trends across years
Check words against results
and the best part , it’s a free tool..
PS: Share this with a friend who still thinks AI can’t help serious long-term investors.
Very interesting article! I also use NLM for quick research. When I discover a new company, I upload the annual reports and let NLM create a mind map to give me a rough idea of the business and its strategy. From there, I then delve deeper into specific areas. NLM feels like a shortcut to reading and understanding a company, but I think that if you really want to understand a company, you have to make the effort to work through the annual reports yourself and get an idea what drives the company.
NotebookLM is my private tutor.