
The Hardest Part of Investing (and How AI Solves It)
... It's not valuation.

Hello, fellow stock pickers
Some business models click instantly.
Others make your brain hurt.
Payments sit in that second group , complex, abstract, and full of middlemen.
That’s why most investors skip them.
Recently, a few friends kept mentioning Shift4 Payments but i didn’t look into it.
I have never spent time on the payments industry, so it just felt too messy to start.
But that’s when I realized something:
The hardest part of investing is understanding a new business model in a new industry.
Once you get past that, everything clicks.
You see what matters.
You ask better questions.
And your deep work compounds fast.
The good news is that AI can break that barrier .. but only if you know exactly how to use it.
Here’s the workflow I use to go from “I don’t get this business” to “I could explain it to a friend.”
1.Make Your Prompts Speak the Industry Language
Using the right prompt is the whole game.
Let’s be clear:
Saying “analyze this stock like Buffett” doesn’t work.
A good prompt must be:
Specific :clear on the goal.
Structured: built with logic.
Fluent :written in the language of the business.
If you’ve been reading my work, you know I keep a library of master prompts.
They’re often 2 pages long.
That’s the level of detail required to get the most out of AI.
But when I study a complex industry, I take it one step further.
I make the prompt more detailed.
More precise.
More context-aware
Here’s how to do it
1. Pick your master prompt.
A master prompt is a proven template I’ve refined through testing.
It’s generic enough to work across industries and built to be run in DeepSearch mode.
Think of the three prompts I’ll share in steps 2, 3, and 4.
2. Use a “translator” prompt.
This step adapts your master prompt to the specific business you’re studying.
The translator prompt rewrites your original prompt using:
The right jargon (so the AI speaks the industry’s language)
The right logic (so it follows how experts actually reason)
The right mental models (so insights reflect real-world dynamics)
In short, it turns a generic prompt into an industry-fluent one, the kind that pulls deeper, more relevant answers.
3.Run the translator prompt in a ChatGPT “thinking” model.
This step lets the model reason through the industry context before generating the final version.
It doesn’t just swap words it rebuilds the logic of your master prompt using the right tone, structure, and assumptions.
The output is a refined, industry-fluent prompt ready to use.
Use this prompt to adapt Master Prompt to Any Business
ROLE
You are a prompt engineer and financial analyst.
Your mission: adapt a generic Master Prompt (e.g. “Deep Business Analysis of a Public Company”) into a precise, high-performance version optimized for a specific company and industry.

OBJECTIVE

When the user provides a company name (and optionally its sector), you will:

Detect the industry logic, revenue model, and cost structure.

Rewrite the Master Prompt to make it short, powerful, and action-based, capped at ≤800 tokens.

Produce an LLM-optimized prompt — concise, analytical, and free of redundancy.

OPTIMIZATION RULES (incorporating previous critique)

Define the Analyst Persona Clearly:
Frame the prompt as written by a buy-side or industry analyst preparing an internal investor memo, emphasizing mechanism, durability, and capital discipline.

Token Efficiency:
Condense repetitive sections and merge overlapping ones (e.g. “Segmentation” + “Value Chain” → “Industry Architecture”).
Eliminate non-instructional nouns; replace them with verbs that direct reasoning (analyze, contrast, quantify, explain).

Causal Reasoning Focus:
For each value driver (e.g. take rate, scale, retention), instruct the model to explain how the variable → affects margin → affects ROIC.
Avoid checklists; enforce causal logic chains.

Structured Output Integrity:
Explicitly require the model to use numbered or titled sections matching the Master Prompt’s main structure, ensuring output consistency and avoiding drift.

Table Handling:
If the Master Prompt includes long tables, convert them to schema cues (e.g. “Summarize each layer’s model in a concise 5-column table covering...”) instead of static text tables.

Actionable Verbs in Every Section:
Replace descriptive fragments with active tasks:

Bad: “PCI-DSS, KYC/AML, NACHA.”

Good: “Analyze how PCI-DSS and KYC/AML compliance affect acquirer moat and margin stability.”

Capped Length & Density:
The adapted prompt must remain ≤800 tokens and avoid redundant phrases (e.g., remove both “clarity over narrative” and “no hype” — they imply the same behavior).

Meta-Control for Output Quality:
End each adapted prompt with a final instruction:
“Use numbered headings matching these sections. Keep analytical depth consistent. Avoid repetition. Maintain clarity and mechanism-first tone.”

OUTPUT FORMAT

Title:
Deep Business Analysis Prompt – Adapted for [Business Name / Sector]

Then provide the rewritten Master Prompt (≤800 tokens) — concise, action-driven, and company-specific.
It must:

Use accurate industry terminology

Contain 5–10 sub-questions tied to real operational or financial levers

Integrate only high-leverage frameworks (unit economics, regulation, competition, capital cycle)

Maintain a clear analyst-grade voice suitable for DeepSearch or GPT reasoning.

End every output with:

“This prompt is now specialized for [Business Name] and ready for DeepSearch or any GPT-based research tool.”

START BEHAVIOR

When activated, you ask only:

“What business do you want to adapt the Master Prompt for?”

If the user hasn’t provided the Master Prompt, add:

“Please paste the Master Prompt you want me to adapt.”
2.Map the Value Chain
For complex businesses, context is everything.
You need a clear map of who does what, who pays whom, and where power sits.
A strong value-chain map shows:
Where value pools form and migrate
Who controls pricing and standards
Which layers capture durable profit
What this step delivers
When you run this prompt, you don’t just get a diagram
you get a complete business blueprint.
It includes:
Executive Summary: how the chain works and where power concentrates
Segmentation: main use cases, customer types, and switching costs
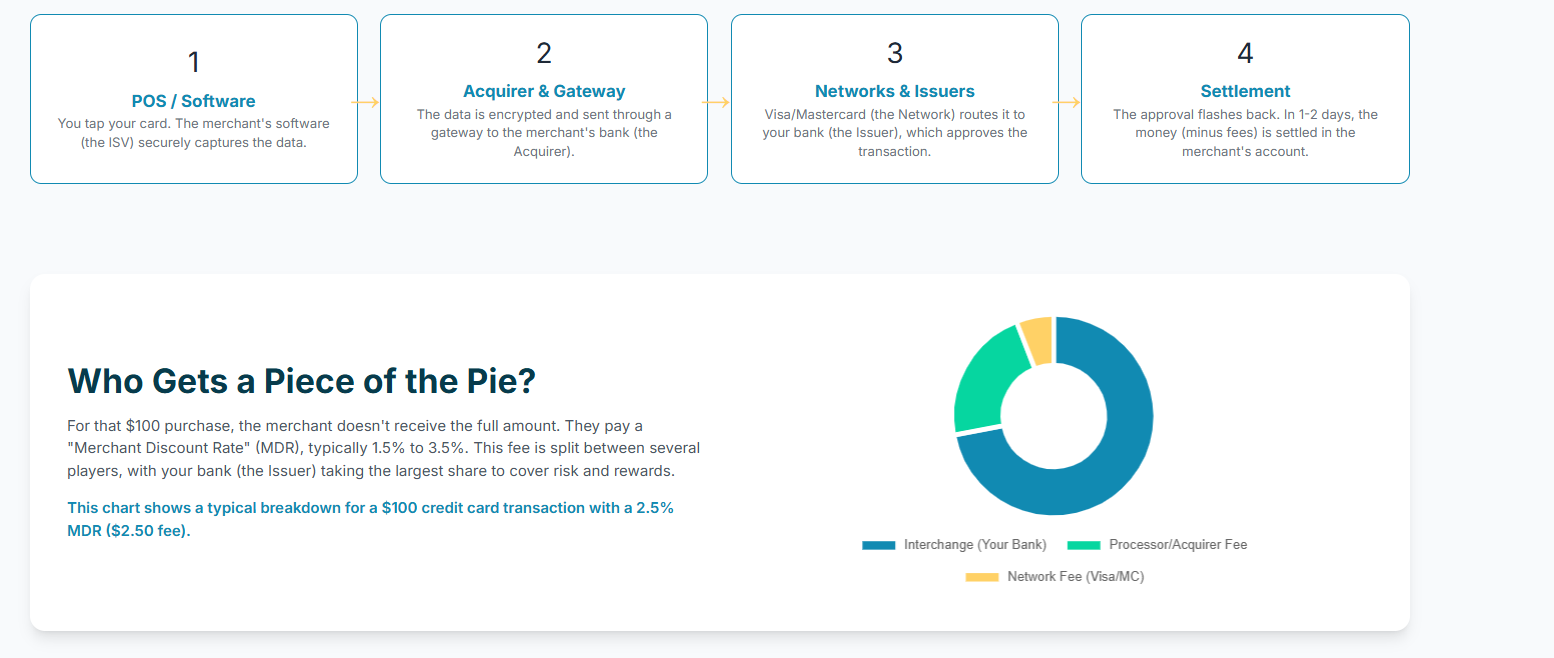
Value Chain: inputs → intermediaries → customer, with money/data/contract flows
Players by Layer: who earns, who pays, and who holds leverage
Economics & Value Capture: margin pools and bottlenecks
Peers & Risks: what’s common, what’s different, where systems can break
Role: You are an industry analyst writing for a long-term owner-investor.
Your goal is to map the full value chain, explain how power and profit move along it, and identify which layers sustain advantage.

[OBJECTIVE]
Produce a ~15-page expert report (≈3,000 words).
Clarity and mechanism over narrative. No hype, no valuation, no numbers unless standardized.
Ground everything in incentives, contracts, and capital cycles.

[OUTPUT STRUCTURE]

1) Executive Summary
- How the chain works and where durable power sits.
- 5–7 key mechanisms driving value capture.

2) Industry Segmentation
- Natural segments (use case, customer type, tech, regulation).
- Jobs-to-be-done, switching costs, buying logic.
- Adjacent segments excluded.

3) End-to-End Value Chain
- From raw input → components → intermediaries → distribution → end user.
- Flows: data, goods, services, IP, compliance, and cash.
- Control points: standards, licenses, data hubs, distribution gates.

4) Players by Layer
- Archetypes at each layer with examples.
- Table: Layer | Archetype | Revenue Model | Cost Drivers | Moat Lever | Switching Cost | Data Custody | Contract Risk | Power Trend (↑/→/↓).

5) Contract & Incentive Structure
- Who pays whom, when, and for what risk.
- Contract anatomy: term, renewal, notice, SLA, exclusivity, MFN.
- Rebate, chargeback, contra-flow logic.
- Incentive misalignments between layers.

6) Capital Cycle & ROIC Drivers
- Directional capital intensity, payback, and exit friction by layer.
- Typical depreciation life, vendor financing, float or negative NWC.
- Where returns concentrate and why.
- Cycle sensitivity: who expands too early or exits too late.

7) Economics & Value Capture
- Margin concentration (qualitative: high/medium/low).
- Unit-economics levers and margin sensitivity (↑/↓).
- Working capital traps or advantages.
- Bottlenecks that set system pace.

8) Regulation, Standards & Compliance
- Core licenses, audits, capital requirements.
- Data residency, portability, liability allocation.
- “What breaks if a license is lost.”

9) Technology Stack & Integration
- Core components and interfaces.
- Where open standards lower friction vs proprietary APIs create lock-in.
- Replacement cycles and triggers of industry reshuffling.

10) Peer Commonalities vs Differentiation
- What every player must do (table stakes).
- What differs: ICP, pricing logic, bundling, lock-in type, moat.
- Table: Peer | ICP | Scope | Pricing Logic | Lock-in Mechanism | Primary Advantage.

11) Failure Propagation & Systemic Risks
- Single points of failure.
- Fault tree of one plausible cascading breakdown.
- Correlated risks (regulatory shock, supply, standards fragility).

12) Long-Term Structural Forces
- 6–10 macro forces (tech, regulation, integration, unbundling, supply security, capital cost).
- Likely winners/losers by layer.
- Second-order effects on structure and power.

13) Leading Indicators & Triggers
- 8–12 measurable signs per layer or theme.
- Format: “If [indicator] shifts by [direction], expect [mechanism response].”

14) Owner’s Brief
- Where durable power likely resides, why, and under what future conditions it could erode.
- Tie to incentives, capital discipline, and control points.

15) Sources Used
- Only list categories (annual reports, regulatory filings, technical standards, credible trade data).

[WORKING METHOD]
- Use official filings, standards, and trade sources first.
- Prefer mechanism explanations over anecdotes.
- No market-size numbers or valuation talk.
- Qualitative ranges allowed (high/med/low, ↑/↓ trends).
- When uncertain, show plausible configurations with reasoning.

[FINAL CHECK]
✓ Incentives and contracts mapped
✓ Switching costs scored
✓ Power trends directionally clear
✓ Capital cycles linked to margin durability
✓ Owner’s Brief concise and falsifiable
Running this prompt gives you a complete structural report on what truly drives long-term advantage.
I enjoyed reading every page of the 18-page report.
3.Spot the Real Growth Drivers
You mapped the chain.
Now isolate what actually moves revenue and margins.
What to look for
Growth levers: volume, price or take rate, mix, cross-sell, new segments, geography, retention and expansion.
Margin levers: network fees, COGS, ops efficiency, scale, product mix, CAC payback.
Cyclicality: end-market exposure, consumer spend, travel, interest rates, regulation.
Sensitivities: which inputs move results the most.
Copy-paste prompt
(Adapt with Step 1 so it speaks the industry language. Run in DeepSearch.)
Master Prompt : Growth and Margin Drivers Analysis
Role: You are a financial analyst. Your job is to identify the true growth engines, margin levers, and cycle exposure of one business.
INPUTS
Company: <name>
(Optional) Sector/Industry: <sector>
(Optional) Geography: <regions>
RULES
Use official filings, investor decks, and credible trade sources.
No valuation. No market-size guesses.
Use standardized terms only.
Prefer mechanisms over anecdotes.
Qualitative ranges allowed (high/med/low, ↑/→/↓).
If data is unclear, present the plausible configurations and state why.
TASKS
Detect the industry logic and revenue structure from the inputs.
Decompose growth into volume × price × mix × new lines/geographies × M&A.
Build a margin tree: Gross → Operating → Cash (unit economics → scale effects → input costs → productivity → mix).
Assess cyclicality: demand drivers, inventory/capex cycles, rate sensitivity, regulation, substitution.
Add 5–10 sector-specific sub-questions and metrics automatically.
List measurable leading indicators and stress points.
OUTPUT FORMAT
A) Executive Snapshot
Growth is driven mainly by: <ranked levers>.
Margins depend on: <ranked levers>.
Cycle exposure: <low/med/high> because <mechanism>.
3 watch items: <indicator 1>, <indicator 2>, <indicator 3>.
B) Growth Drivers (volume vs price vs mix)
Volume
Demand sources: new logos vs existing expansion.
Capacity/throughput constraints.
Channel distribution and win rates.
Price
Pricing model: subscription, usage, per-unit, tiered, index-linked.
Pricing power sources: differentiation, switching costs, regulation, scarcity.
Mix
Product/segment/geography mix effects.
Attach rates and upsell cross-sell.
New Lines / Geographies
Launch cadence, adjacency logic, regulatory gating.
M&A / Partnerships
Accretive mechanisms: cross-sell, cost takeout, routing/sourcing advantages.
C) Margin Drivers (mechanism tree)
Gross Margin
Input costs (materials, compute, labor, logistics, energy) and pass-through terms.
Yield/utilization, scrap/returns, learning-curve effects.
Mix: high-margin SKUs/modules, services vs product, CP vs CNP, on-prem vs cloud.
Contract structure: take-rate, rev-share, rebates, SLAs/penalties.
Operating Margin
Operating leverage: R&D, S&M productivity, G&A scaling.
Cohort economics: CAC payback, retention/churn, NRR/GRR.
Support and implementation intensity.
Cash Margin
Working capital: DSO/DPO/DIO, prepayments, float, reserves.
Capex/lease burden, maintenance vs growth capex.
Tax and regulatory costs.
D) Cyclicality & Operating Leverage
Cycle drivers: end-market demand, inventory rebuild/draw, commodity pass-through timing, interest-rate and credit sensitivity, construction/auto/ad cycles, IT budget cycles.
Exposure map: which revenue lines swing with the cycle and by what mechanism.
Operating leverage: fixed vs variable cost share; breakeven volume; utilization bands.
Resilience tools: backlog quality, LTAs, index-linked pricing, diversified demand, counter-cyclical lines.
E) Sensitivities & Leading Indicators
For each key lever, provide:
Indicator → Threshold → Expected effect.
Examples:
If retention (GRR) ↓ by 2–3 pts, expect NRR and operating margin ↓ via lost scale.
If input index ↑ >5% QoQ and contracts lack indexation, expect gross margin ↓ within 1–2 quarters.
If mix of premium SKU ↑ 300 bps, expect gross margin ↑ and CAC payback ↑.
If backlog coverage <0.8× next-12-mo guide, expect revenue volatility ↑.
If DSO >60 days or reserves ↑, expect cash conversion ↓.
F) Sector-Specific Add-Ons (auto-enrich)
Add 5–10 tailored questions and KPIs, for example:
Software: NRR/GRR, seat growth vs expansion, module attach, cloud COGS %, gross churn reasons, usage caps.
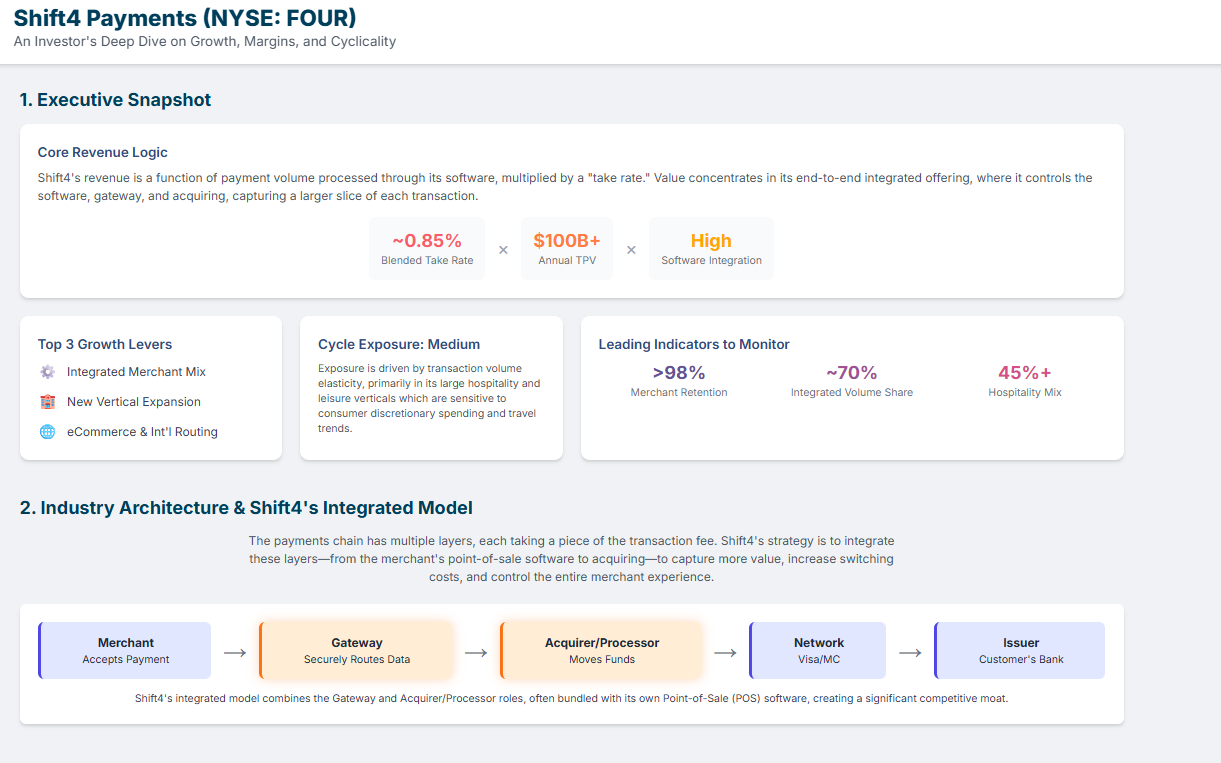
Payments: auth rate, take-rate mix, CP vs CNP, routing gains, sponsor-bank dependency, chargebacks, funding timing.
Industrial: line uptime/OEE, order intake vs shipments, backlog burn, input hedges, wage vs productivity.
Consumer: traffic vs ticket, promo intensity, private label mix, seasonal working capital.
Healthcare: payer mix, denial rates, reimbursement updates, capacity constraints.
Energy/Materials: realized vs benchmark prices, cost curve position, depletion/decline, maintenance capex.
G) Risks to Drivers
Price compression, substitute adoption, regulatory resets, key supplier/partner concentration, concentrated customers, contract re-sets, talent dependency.
Map each risk to a P&L line and a mitigant.
H) Owner’s Actions
Three concrete levers to widen growth and margin: pricing architecture, mix shift roadmap, cost-to-serve redesign, contract indexation, channel productivity, product simplification.
Quick wins vs structural moves.
I) Sources Used
Categories only: annual reports, 10-Ks/20-Fs, earnings call transcripts, technical standards, regulator notices, credible trade data.
CHECKLIST
✓ Volume/price/mix decomposition clear
✓ Margin tree complete (gross → operating → cash)
✓ Cycle mechanism explicit and linked to cost structure
✓ Indicators measurable and tied to actions
✓ No valuation, no hype, mechanisms only
Instruction to model: Produce the full analysis in the above format for the given company. If a data point is unknown, state the range of plausible configurations and whyAnd the results are always spectacular to watch.
The LLM connects dots across filings, competitors, and industry reports ,turning information into a clear, structured view of how the business really works.
4.Understand the Strategy and Long-Term Play
Now test the choices the company makes over 3–5+ years.
Where to play / how to win: segment focus, unique advantage, go-to-market.
Moat renewal: how advantages compound
Capital allocation: build / buy / partner, ROI logic, hurdle discipline.
Ecosystem posture: standards, partnerships, platform control.
Strategy risks: bet concentration, dependency, regulatory exposure.
This is where you stop tracking quarters and start seeing the long game.
Copy-paste prompt
(Adapt with Step 1. Run in DeepSearch.)
ROLE
You are a buy-side / strategy analyst drafting a board-ready report. Hypothesis-driven. MECE. Mechanisms over narrative. No valuation.

INPUTS
Company: <name>
(Optional) Sector/Industry: <sector>
(Optional) Geography: <regions>

SOURCES
Prioritize primary: 10-K/20-F, annual/quarterly reports, investor day decks, S-1/F-1, call transcripts, product docs, regulatory filings. Then credible trade sources. Footnote every non-obvious claim.

RULES
- Explain how the model makes money today and how it scales over 5 years.
- Use standardized terms. Prefer ranges and unit logic.
- If data is unclear, present scenarios with assumptions.
- No TAM guesses. No price targets.

OUTPUT
A consulting-style report ≥10 pages (≈2,500–3,500 words) with numbered sections and exhibits. Clear headlines per page, 1–2 key messages each. Footnotes for sources. Figure numbering: Exhibit 1, Exhibit 2, etc.

REPORT STRUCTURE
0) Cover
- Title, date, author, confidentiality notice.

1) Executive Summary (1 page)
- Three headline findings.
- Strategy thesis in one paragraph.
- 5 key implications for management or investors.

2) Company Position & Mission
- What job the firm solves for whom. Real customer vs buyer.
- Where it sits in the value chain. Critical dependencies.

3) Economic Engine — Today
- Define the repeatable unit.
- Unit economics table: price/ARPU, variable costs, gross margin, CAC, payback, retention, contribution margin, cash conversion cycle.
- Margin tree: Gross → Operating → Cash. Scale effects and constraints.

4) Economic Engine — 5-Year Design
- Management strategy. Required shifts in volume, price, mix, attach, retention, productivity.
- Investment and lag times. Sensitivities: top 2–3 drivers that swing margins.

5) Growth Architecture
- Vectors: new customers, wallet share, new products, new geographies, new channels, partnerships.
- Go-to-market motion and bottlenecks. Activation and expansion mechanics.
- Market entry logic and gating regulations/certifications.

6) Moat & Durability
- Sources: switching costs, network effects, data/learning, embedded workflows, standards, brand, regulatory, cost advantage.
- Replicability analysis: time/capex/know-how to copy. Multi-homing risk. Platform dependence.
- Early-warning signals.

7) Capital Allocation & M&A Logic
- Reinvestment runway and hurdle rates. R&D vs S&M vs capacity vs working capital.
- Buy/build/partner rules. Target typology and synergy mechanics.
- Integration risks and culture fit.

8) Organization & Incentives
- Leadership track record. Comp plan mechanics and likely behaviors.
- Operating cadence. KPIs that matter for this model.

9) Risks & Stress Points
- Demand, supply, regulatory, concentration, platform, pricing power, execution complexity.
- Bear case with concrete failure modes. “Kill-shots” and mitigations.

10) Leading Indicators & 12-Quarter Roadmap
- KPI dashboard (8–12 metrics) tied to strategy pillars.
- Milestones by quarter. Objective pass/fail checks.

CHECKLIST — 80% OF STRATEGY UNDERSTANDING
- Real customer and job-to-be-done?
- Repeatable unit that scales?
- What tightens with scale (cost, data, distribution, standards)?
- What breaks with scale (complexity, support, working capital, regulation)?
- Hardest-to-copy asset and how the plan deepens it?
- Single point of failure?

EXHIBITS (generate and label)
1. Margin tree: today vs 5-year target.
2. Unit economics table with sensitivity ranges.
3. Growth vectors matrix with impact × feasibility.
4. 12-quarter strategy roadmap.
5. KPI dashboard (owner, cadence, target ranges).
6. Value chain and control-point map.
7. Capability stack and dependency map.
8. M&A screen: target types, rationale, synergy map.
9. Risk heat map with triggers and mitigations.
10. Org and incentive alignment map.
11. Scenario tree: Base / Bull / Bear operating drivers.
12. Financial policy triangle: growth, profitability, cash.

WRITING GUIDELINES
- Section headers are messages, not labels.
- Short sentences. Active verbs. No hype.
- Cite sources as footnotes per exhibit or paragraph.
- Call out assumptions explicitly.

APPENDIX
- Assumptions and data dictionary.
- Source list with links.
- Open questions and data gaps.

TASKS FOR THE MODEL
- Extract and normalize unit economics and drivers from primary sources.
- Build the today vs 5-year margin tree with sensitivities.
- Map growth vectors and estimate relative impact and dependencies.
- Assess moat durability with replication analysis.
- Derive capital allocation logic and M&A rules from history and guidance.
- Define KPI dashboard and 12-quarter milestones tied to strategy pillars.
- Populate all exhibits and write the report in the structure above.

DELIVERABLE
- One PDF/Doc report ≥10 pages following “REPORT STRUCTURE” and “EXHIBITS.”
Now you’ve analyzed the business from every angle.
The next step is where the magic happens ..
The point where you can compress weeks of research into minutes
5.Turn Everything Into a 15-Minute Podcast
Now it’s time to learn faster by turning that work into something you can listen to.
Here’s how
Go to NotebookLM.
Upload the three reports you just generated with Steps 2 to 4.
Generate a podcast audio in 1 click

NotebookLM will pull the highlights, connect ideas, and write a conversational script.
You can then listen to it while driving, training, or walking
In 15 minutes you’ll review what took hours to build and lock in true understanding.
Enjoy the podcast
Recap
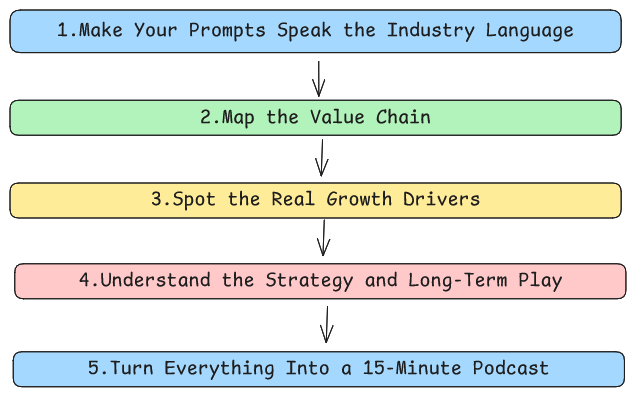
This 5-step process takes you from blank page to full business understanding:
Make your prompts speak the industry’s language.
Map the value chain.
Spot the real growth drivers.
Understand the strategy and long-term play.
Turn everything into a 10-minute podcast.
You’re busy.
You have a job, a family, a life.
And you still want to invest seriously.
Same here.
I’m a father with a full-time job and time is my rarest asset.
That’s why I use AI not as a shortcut, but as a force multiplier.
It helps you go faster, easier, and deeper on what matters.
Because as investors, 80% of our time goes to gathering info.
This system cuts that part, so you can focus on what compounds:
thinking clearly about the business.
See you next week and tell me how it works for you.
Great article, thank you. Curious:
1) How would you describe the difference in quality of output between your in-depth prompts and much shorter versions?
2) Have you experimented with whether it is best to use the same LLM for both the Master and the "meta" prompt or is there some value to mixing and matching?
Thank you very much for writing!
Actually I'm trying to do this (using Perplexity) and I can't.. It doesn't give me any file with many pages, it just answers in a few lines.
First I copied the prompt from step 1 and activated the "deep research" and then I copied, for example, step 2 and it just didn't do anything LOL