Understand Any Business in 5 Steps (Without Reading 1,000 Pages )
The only workflow you’ll ever need to break down any business
The biggest leverage AI gives you is understanding businesses fast.
Going from “that stock looks cheap” to “I actually get how this company makes money” takes time.
Sometimes hours, sometimes weeks.. depending on the business and the time you have.
With the right prompts and structure, AI cuts that learning curve by 10 X.
Here’s the 5-step workflow I use to go from 0 to clarity on any business with AI:
Step 1: Collect Your Sources
Start with the foundation:
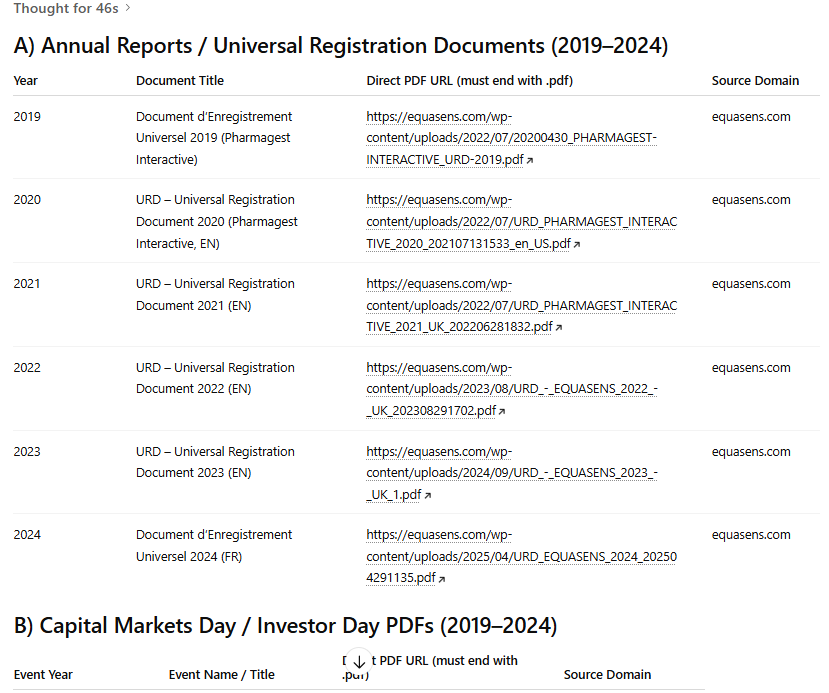
Download the last 5 to 10 annual reports.
Add any Capital Markets Day or Investor Day PDFs if they exist.
That’s usually enough to see how the company evolved and where it stands today.
You’ll find these on the Investor Relations page, but downloading them one by one is slow.
Let ChatGPT do it for you in seconds.
Copy and paste this prompt:
You are a research assistant specialized in retrieving official investor documents.
Goal:
Collect verified, official PDF files for a specific public company.
Company: [Insert Company Name] operating in [Insert Sector]
A) Annual Reports (primary task)
Retrieve only Annual Reports, Form 10-K, or Universal Registration Documents for the exact years 2019, 2020, 2021, 2022, 2023, 2024.
Return only direct downloadable PDF links (URL must end with .pdf).
Sources must be official:
Company investor-relations website
Official regulators (e.g., SEC.gov, AMF-France.org, Companies House, Borsa Italiana, etc.)
Exclude HTML pages, aggregators, press releases, CSR/ESG reports, presentations, or interim results.
If both English and another language exist for the same year, keep only one: English if available, else the original language.
If the company changed names, search prior names to locate older filings.
Return exactly one verified PDF per year, in chronological order.
Output as a clean table with columns:
Year
Document Title
Direct PDF URL (must end with .pdf)
Source Domain
Ensure each link is direct-downloadable (usable with wget or curl).
B) Capital Markets Day / Investor Day (secondary task)
Search for Capital Markets Day or Investor Day materials within 2019–2024.
Accept PDFs only (URLs must end with .pdf). Prefer English; if not available, use the original language.
Sources must be official (company IR site or official exchange/regulator portals).
Exclude non-PDFs, media articles, and third-party summaries.
Output a separate table titled “Capital Markets Day / Investor Day PDFs (2019–2024)” with columns:
Event Year
Event Name / Title
Direct PDF URL (must end with .pdf)
Source Domain
Formatting:
Provide Section A table first (Annual Reports), then Section B table (CMD/Investor Day).
Do not include anything else.
In less than a minute, you’ll have all the official links listed in one clean table.
Just click, download, and upload them :
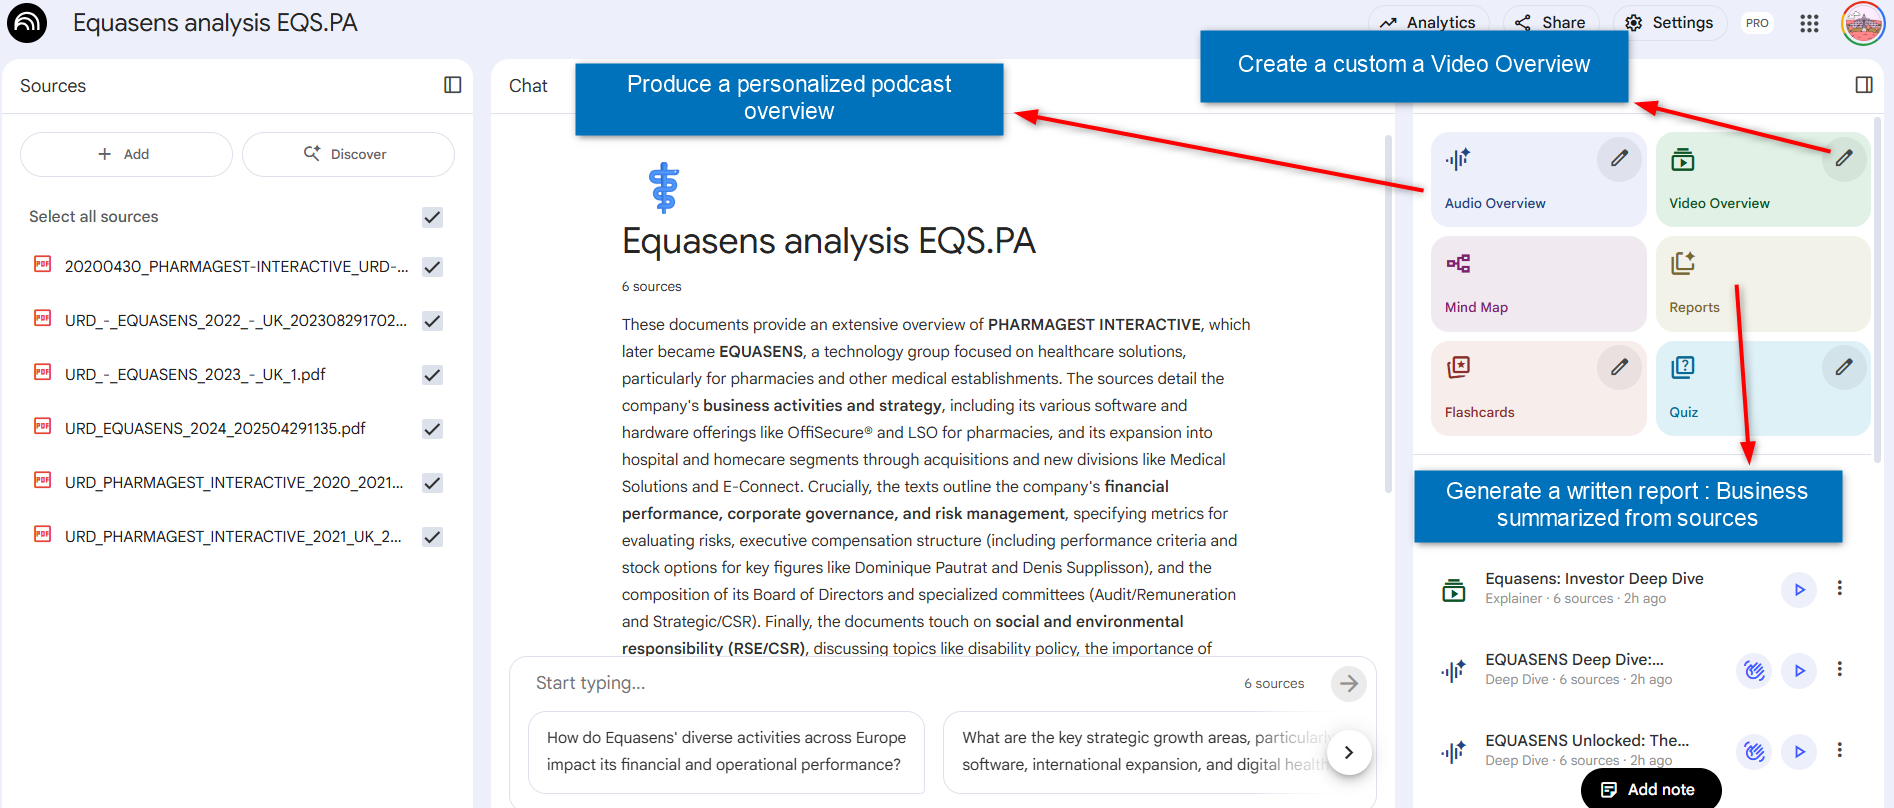
After downloading, upload everything into a new notebook.
That becomes the database for your analysis.
NotebookLM only uses your uploaded files, so every insight stays factual and source-based.
Note: I tested this prompt on 10 stocks using 3 different LLMs.
ChatGPT gave the best results, with an error rate around 3%.
Even if one link fails, downloading it manually is still much faster than doing the whole process by hand.
Step 2 : Get the Big Picture
I always start with a 15 minute overview to quickly understand what the business does and how it makes money.
But everyone learns differently.
Some people read.
Some listen.
And some need moving pictures because their brain refuses to process another paragraph after 6 p.m
The good news?
NotebookLM works for all of us, no matter how we learn:
Create a custom written report that summarizes how the business works.
Generate an audio overview you can listen to while driving or at the gym.
Build a short video walkthrough to visualize how the company makes money.
Pick your format, spend 15 minutes, and you’ll get the kind of clarity that usually takes hours of reading documents.

How to turn 500 pages into a summary you’ll actually Read:
For all my investor friends who love to read, this step is a game changer.
It will generate a high-quality report that replaces hundreds of pages of annual reports.
Let me show you how :
Open your Notebook
Click Create Report → Custom Report.
Paste this prompt inside the instructions box:
Create a professional equity analyst report for long-term investors.
The tone should be analytical, factual, and concise.
Structure the report so it starts with an Executive Summary, then expands into the detailed sections below.
Report Structure:
Executive Summary (150–200 words)
Explain how the company makes money, the quality of its economics, and its key risks or advantages.
End with one sentence that sums up the business in plain English, as you’d describe it to an investor.
What They Sell and Who Buys
Summarize the main products or services and who the target customers are (type, segment, geography).
Clarify the core need or motivation driving customer purchases.
How They Make Money
Explain the revenue model (recurring, one-time, transaction-based, hybrid).
Mention key revenue segments and their relative size if available.
Revenue Quality
Evaluate how predictable and diversified revenues are.
Break down recurring vs one-off exposure and identify any concentration risks.
Cost Structure
Outline the major cost components (COGS, labor, marketing, logistics).
Note gross and operating margins where possible and discuss scalability.
Capital Intensity
Describe asset requirements, capex, and working-capital needs.
Comment on cash conversion and efficiency.
Growth Drivers
Identify the main levers of growth (pricing, volume, new products, acquisitions, geography).
Distinguish between structural vs cyclical growth factors.
Competitive Edge
Explain what protects the company’s economics (brand, cost advantage, switching cost, regulation, network effects, IP).
Assess how durable the moat appears using financial evidence (margins, ROIC, retention).
Goal:
Produce a clear, structured report that lets an investor quickly understand how this business operates, earns money, and sustains its performance over time.
This gives you a clean, structured equity analyst report built entirely from the company’s own filings.
It’s a 7-page summary you can read in under 10 minutes.
Note:
You can generate a standard report in NotebookLM.
It gets the job done, but I prefer going one step further with the custom Report.
I tested both on several companies, and the difference is clear:
The custom report follows a clear structure: key summary first, deep dive after.
It aligns better with how I approach investing and focuses on what truly matters to understand a company.
Create a Podcast You’ll Actually Enjoy (Tailored to You):
This is one of the best productivity hacks for research.
Listening to an audio overview lets you learn about a business while driving, walking, or at the gym.
It turns passive time into research time.
NotebookLM can automatically create a podcast-style audio summary from your uploaded sources.
But I prefer customizing it to get more value from the analysis:
Open your notebook
Click Audio Overview → Customize Audio
Paste this prompt and Generate
you’ll have a focused audio summary explaining how the company works, how it makes money, and what drives its growth ready to listen anywhere.
Focus for hosts:
Explain the company like professional equity analysts guiding long-term investors.
Base everything on the uploaded annual reports, focusing primarily on the latest report for the business model, segments, and financials.
Use older reports only to show how the story evolved (growth, margins, capital allocation).
If several segments exist, mention all briefly, but focus analysis and examples on the largest contributors to revenue and profit.
The goal: make the listener truly understand how the company works, the industry it operates in, and what drives its economics and investment case, with clear logic, relatable examples, and analytical depth.
In this episode, the hosts should follow this flow:
1. Opening (context )
Start with a one-line summary of what the company does and why it matters to investors.
2. Industry Overview (set the stage)
Explain the industry or market the company operates in.
Clarify the main problem or customer need the industry solves.
Mention key growth drivers shaping the industry (technology, regulation, demographics, habits).
Highlight any structural challenges or constraints (competition, pricing pressure, capital cycles, regulation).
End this section by showing where the company fits within that landscape — leader, niche player, or challenger.
3. Deep Business Model Breakdown (main section — spend the most time here)
Explain how the company makes money, step by step.
Describe what it sells, who pays, how pricing works, and how cash flows through the system.
Use concrete examples and simple analogies to make each mechanism clear
Anchor on latest-year numbers — revenue by segment, margin, and growth direction.
When multiple segments exist, cover all briefly but zoom in on the largest revenue and profit engines.
Highlight the core economic engine — what truly drives value creation.
4. Revenue Quality & Profitability
Discuss stability and diversification of revenues.
Compare recurring vs one-off income and segment dependence.
Explain margin drivers and what influences profitability (volume, mix, cost structure).
5. Capital Intensity & Cash Flow
Describe what assets or investments are required to grow.
Explain cash conversion efficiency, capex, and working-capital needs based on the latest report.
6. Strategic Priorities & Capital Allocation
Summarize management’s current goals and key initiatives.
Review capital allocation choices — reinvestment, M&A, buybacks, dividends, or debt reduction.
Explain how these decisions align with long-term value creation.
7. Competitive Edge & Risks
Explain what protects returns: brand, cost advantage, regulation, switching costs, or technology.
Highlight barriers to entry and mention emerging threats or risks from filings.
8. Investment Takeaway (closing)
Summarize the story in one clear sentence an investor could repeat.
Add one or two lines about why this business could continue to compound — or what might break it.
Tone:
Conversational yet analytical.
Use vivid examples and plain English to simplify complex ideas without losing precision.
Keep the latest data and real numbers central to the story.
Maintain a smooth narrative arc — from industry context → how the company makes money → how it performs → why it matters for investors.
Note: I tested both the automatic and custom audio summaries in NotebookLM, and here’s what I found.
The automatic version works, but it has a few blind spots:
It often misses the key parts of the business , treating a small segment that makes 1% of revenue the same as the one driving 90%
It sometimes pulls examples from older reports instead of focusing on the most recent data.
It often focuses on secondary topics like ESG instead of explaining how the business actually works, who its customers are, and what drives its growth
That’s why I use a custom prompt for the audio overview.
Pro tip: If you want to listen and follow the podcast easily, download the NotebookLM app.
All the audio summaries you generate will sync to your device and be ready to play anytime.
(At this point, Google should probably send me a paycheck for all this free advertising.)
How to Create a Visual Explainer:
A video overview is perfect when your brain is done reading but you still want to learn something useful.
The mix of sound and visuals makes it easy to follow, even when you’re tired and it’s a much better use of time than scrolling or watching Netflix.
Here’s how to create it :
Open your notebook.
Click Video Overview in the Studio section.
Choose your language and visual style
In the “What should the AI hosts focus on?” box, paste this prompt:
Goal:
Produce a visual explainer for long-term investors using only the uploaded annual reports.
Base the explanation and visuals on the latest report, using older reports only to illustrate growth or margin trends.
If several business segments exist, mention all but emphasize visuals and narration on the segments that drive the most revenue and profit.
Storyboard guidance:
Intro slide: what the company does today (latest report).
Diagram: how the company makes money — key revenue streams and model type.
Segment chart: show all segments, then zoom in on those with the highest revenue and margin contribution.
Customer slide: who buys and what problem is solved.
Revenue quality graphic: recurring vs one-off, diversification, concentration.
Cost and margin slide: major cost drivers, operating leverage, profit mix.
Capital intensity visual: assets, capex, cash conversion cycle.
Strategic priorities slide — goals, initiatives, milestones from latest report.
Capital allocation slide — reinvestment, M&A, dividends, buybacks, debt.
Moat summary slide — what protects economics (brand, scale, regulation, etc.).
Closing frame: one clear sentence summarizing the business as an investor takeaway.
In a few minutes, you’ll have a short, animated video that makes the business clear and easy to follow .
Step 3 : Go Deeper with the Business Map
Once you’ve nailed the basics, it’s time to go deeper.
Forget reading 10 years of reports.
Let NotebookLM do the heavy lifting.
Generate a Mind map and watch the company unfold:
Segments
Products
Financial drivers
Risks
All grouped visually, all sourced from the files you uploaded.
Click any section and it expands instantly.
It’s the fastest way to connect the dots.
If you want to dig deeper:
Click on any topic to open a detailed tab.
For example, if you want to understand the capital structure or how the company is linked to “La Coopérative Welcoop”, just select that section.
NotebookLM pulls the explanation directly from your uploaded reports.

You can then keep digging by asking follow-up questions on the same topic.
Step 4 Extract the Data You Need
Once you understand the story, it’s time to look at the numbers.
You can use this prompt directly into NotebookLM:
NotebookLM will go through all the annual reports you uploaded.
It extracts the numbers only from those files no external data added.
It builds a clean financial table that follows your exact instructions.
It also validates the data before returning results and runs its own calculations
You are a financial analyst.
From the attached annual reports (7–10 years, one company), extract historical financials into a table, then fact-check your own work to avoid copy/paste or calculation mistakes.
TASKS
Extract these metrics (group totals):
- Revenue
- EBITDA (use reported; if not reported, compute = EBIT + D&A and label “computed”)
- Depreciation & Amortization (D&A)
- EBIT (Operating Income)
- Net Income
Calculate:
- YoY Growth % for Revenue, EBITDA, EBIT, Net Income
- Margins %: EBITDA/Revenue, EBIT/Revenue, Net Income/Revenue
Formatting rules:
- Auto-scale numbers
- State unit once at the top: “Figures in [currency] [millions/billions]”
- Round % to 1 decimal
- Use “—” if missing
OUTPUT — STRICT ORDER
Part A — TABLE (Markdown; years as columns)
Rows in this order:
Revenue | Revenue Growth % | EBITDA | EBITDA Growth % | EBITDA Margin % |
D&A | EBIT | EBIT Growth % | EBIT Margin % |
Net Income | Net Income Growth % | Net Margin %
Part B — FACT CHECK
Recompute growth % and margins directly from extracted numbers.
If difference >0.1pp or 0.1 unit, flag with ✗ and corrected value.
If consistent, mark ✓.Here are the results.
You can organize your data however you prefer, but I like seeing my numbers like this clear, structured, and easy to compare year by year.
If any numbers are calculated instead of directly reported, double-check them
Step 5: Ask deep questions
Once you’ve explored the business and reviewed the numbers, start asking deeper questions.
This is where NotebookLM becomes a real research assistant.
For example:
If the overview or mind map mentions a regulation like Ségur (from the French government), you can ask:
“What is the real financial impact of the Ségur program on the company?”
NotebookLM will:
Search only within your uploaded reports.
Pull every mention of that regulation or policy.
Summarize the impact with direct citations from official sources.
Notebook will always pull the answer straight from your reports, quote the source, and show you exactly where it found it.
Recap: The Workflow You Can Reuse
Collect
Grab official PDFs with the retrieval prompt. Annual reports and Investor Day.Summarize, Listen or watch
Create a 10-minute custom report in NotebookLM.
Generate an audio overview for the commute or a visual explainer for tired brains.Map
Build a Business Map. Segments, customers, drivers, risks. Click to expand.Extract
Pull10 years of KPIs into a clean table.Ask
ask targeted questions that force citations and number.
Use it across companies:
Run the same prompts on several businesses.
Tweak wording over time to match your style.
Most important: use it. Do not stop at “nice idea.”
AI becomes an edge only with practice.
PS: If you want to go beyond reading and want to build your AI investing system,
I’m running a live paid workshop in next weeks :
Analyze Any Stock 10× Faster with AI:
In 90 minutes, I’ll teach the exact workflow I use to go from company name to clear investment thesis with Gemini.
You’ll learn:
How to use Gemini Deep Research step by step
The exact prompt I use for every stock
How to apply it on a real company live, with full walkthrough and Q&A


