
Use AI to Spot Risks You’re Too Biased to Notice
A 3 steps system to copy

AI’s biggest advantage is simple: it’s a machine.
At least for now...
And that one fact gives it an edge no human investor will ever have.
A machine doesn’t get attached to a stock.
It doesn’t fall in love with a CEO.
It doesn’t justify red flags because “the story is still good.”
As investors, we have a tendency to ignore risks until they hit us in the face.
Here’s a 3 layers system to use AI to spot the real business risks before market sees them:
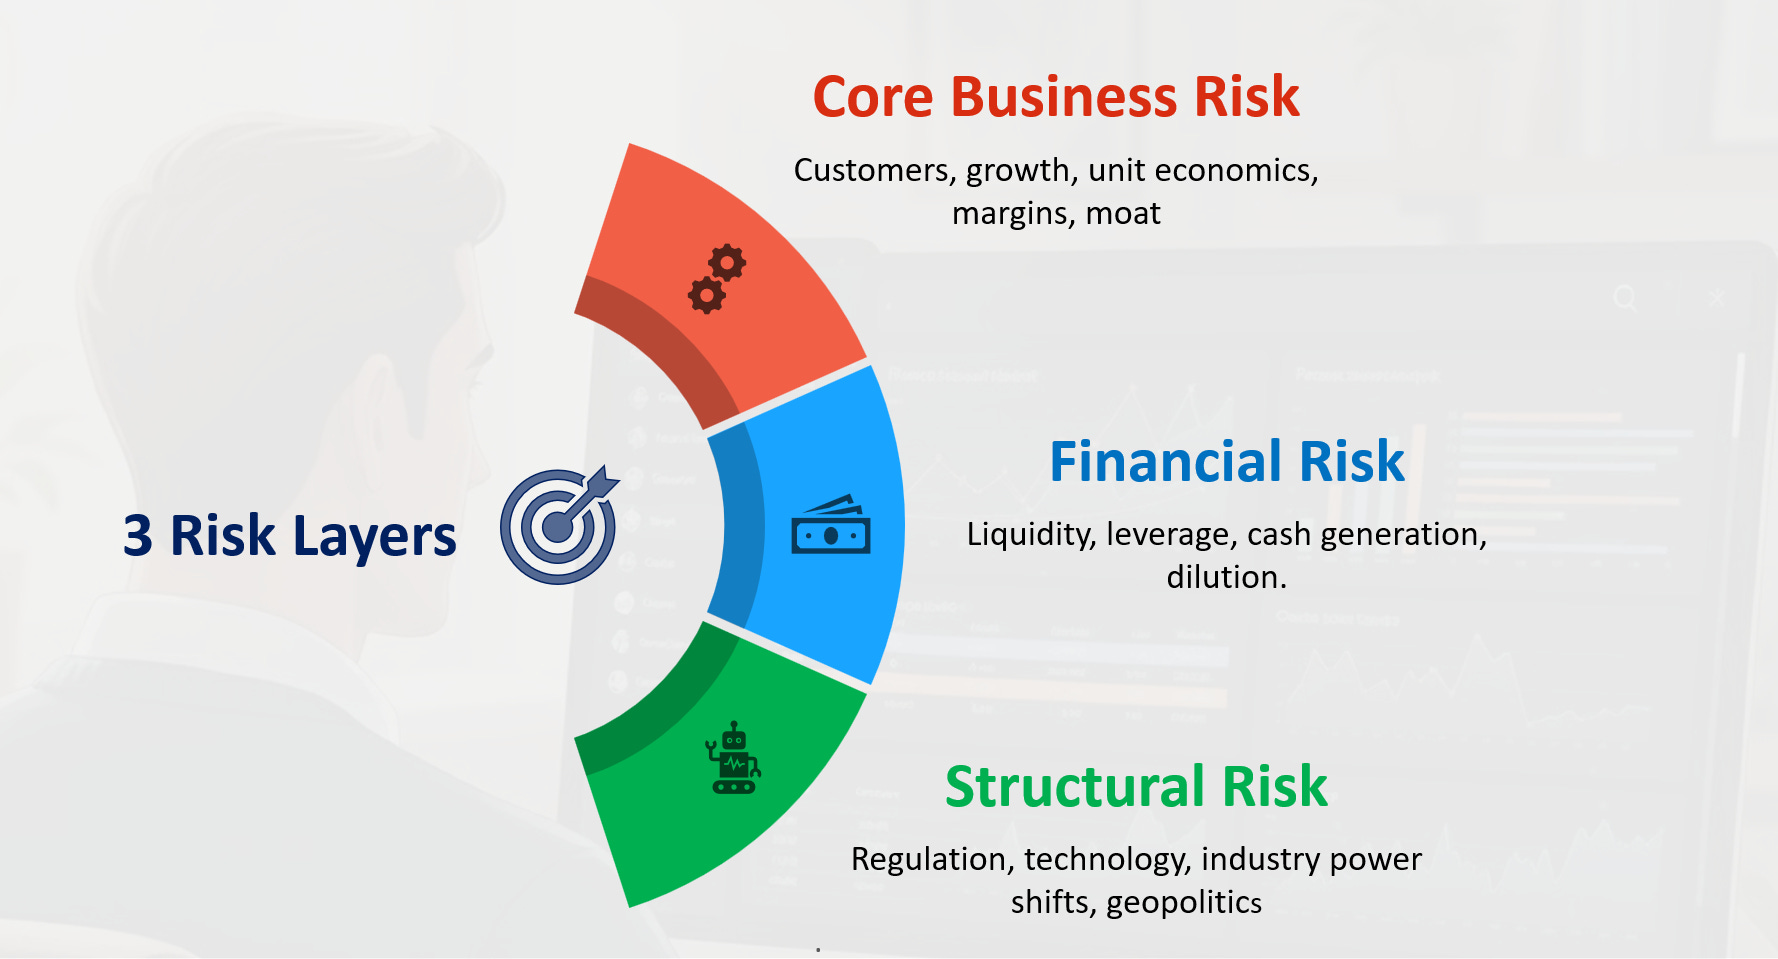
Each layer checks a different angle, and together they give you the full picture of what can break it:
Layer 1 : Inside the business: the operational engine (customers, margins, growth, moat).
Layer 2 : Behind the business: the financial foundation (liquidity, leverage, cash flow).
Layer 3 : Around the business: the external forces (regulation, technology, industry shifts).
Let’s break it down.
Each layer comes with one copy-paste prompt so you can run it immediately.
Layer 1 : Core Business Risk
Layer 1 identify what could break the business from the inside.
It’s about the real mechanics of the business not the accounting.
This step answer one key question:
“Is the business engine truly strong… or already showing early cracks?”
You pressure-test everything that keeps the machine running:
Why customers leave
What slows growth
What compresses margins
Which parts of unit economics are fragile
How the moat could erode
What trends signal early weakness
If you skip this, every other layer loses meaning.
You must understand the engine first.
Prompt Layer 1 (Copy-Paste Ready)
Role:
You are my senior business analyst. Your job is to produce a clear, rigorous, evidence-driven diagnostic of the company’s Core Business Risk (Layer 1).
Company: [insert your stock here]
Mission:
Identify, explain, and quantify the true operational risks that could materially weaken the company’s core engine: moat, customers, revenue drivers, margins, and unit economics.
1. Executive Summary (start with this)
Give a concise, structured summary of the 5–7 highest-impact risks, ranked by severity and likelihood.
Each item = one line: Risk → Why it matters → Evidence indicator.
2. Customer Risk
→ Why could customers leave?
List all realistic reasons and give concrete triggers: price, switching cost, product relevance, quality, alternatives, budget cuts, onboarding friction.
→ Impact on business
Explain how each scenario affects:
revenue
average spend
retention
sales cycles
expansion rate
→ Evidence check
Are there current signs in filings or data that any scenario is starting? (Yes/No + 1 line proof)
3. Growth Risk
→ What could make revenue stop growing?
Analyze barriers: TAM saturation, competitor encroachment, product fatigue, weaker pipelines, sales execution, distribution constraints.
→ Impact quantification
Describe how each factor would hit:
top line
new customer acquisition
pricing power
wallet share
→ Early indicators
Highlight signals the company should monitor.
4. Margin Risk
→ What could make margins decline?
Assess mix shift, pricing pressure, COGS inflation, new product dilution, loss of economies of scale, weaker utilization.
→ Unit economics view
Explain which parts of the model are sensitive and why.
→ Evidence check
Show relevant trailing trends if visible.
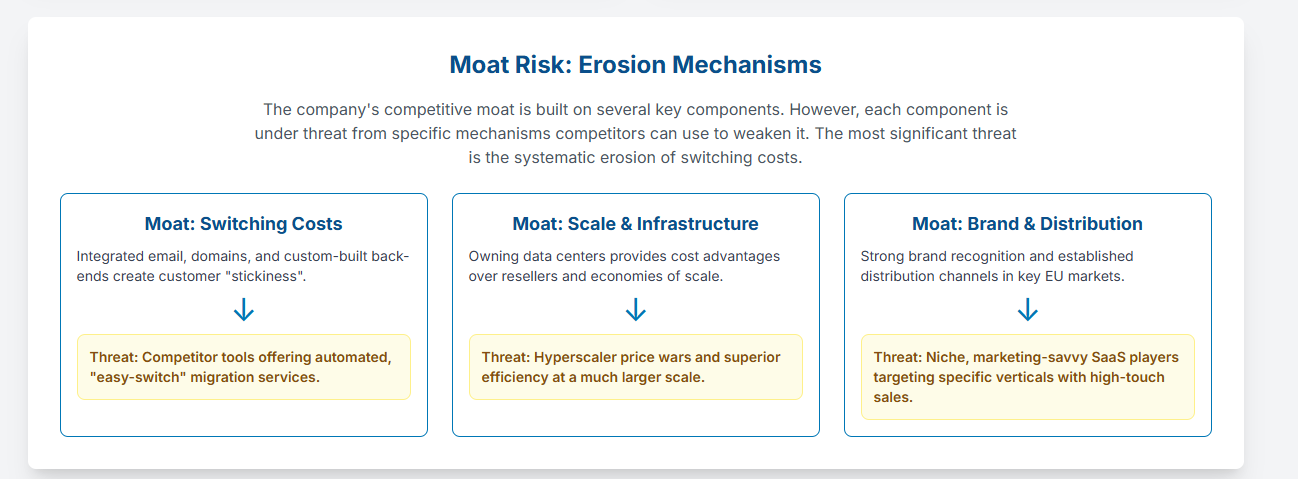
5. Moat Risk
→ What is the moat? Break it down.
Switching costs, brand, network effects, scale, IP, distribution, regulation.
→ What could erode each moat?
Identify mechanisms competitors might use to weaken it.
→ Detect early signs of erosion
Give concrete metrics to track.
6. Final Diagnostic
A table with:
Risk
Severity (High / Medium / Low)
Likelihood (High / Medium / Low)
Evidence today
Management’s ability to mitigateI ran this layer on IONOS Group SE : a European cloud-hosting provider.
It’s the stock I’m digging into right now.
And Layer 1 instantly gave me clarity: where the engine is strong, and where the real business risks live.
Layer 2 :Financial Risk Diagnostic
After checking the engine , the next step is to look behind the business at the financial foundation holding everything together.
Layer 2 asks one question every investor needs answered:
Can this company survive stress… or does one bad cycle break it?
It’s about evaluating proportional, evidence-based financial risks:
Liquidity (cash buffers, short-term safety)
Leverage (net debt vs cash generation)
Debt sustainability (maturities, interest coverage)
Cash flow durability (FCF stability across cycles)
Dilution risk (SBC, share count, capital allocation)
Working-capital behavior (patterns that hide fragility)
Prompt Layer 2 (Copy-Paste Ready)
Goal
Run a Financial Risk Diagnostic (Layer 2) for [insert your stock here]
that identifies material risks only.
Do not inflate minor risks or create problems when the balance sheet is clearly strong.
Risk Philosophy
A risk is material only if it could realistically impair value based on current evidence.
If debt is small relative to cash and FCF, the correct conclusion is Low or Negligible risk.
The model should not turn theoretical scenarios into real risks unless supported by data.
Strengths must be weighted equally to risks.
What to Avoid
No “forced” red flags.
No alarming tone if metrics are healthy.
No theoretical risks unless they are plausible and show evidence.
Judgment Rules
When evaluating any subtopic, always answer:
Is there real evidence of risk?
Is the risk material given cash position, FCF, and leverage?
Would this realistically harm the company in the next 3–5 years?
If the answer is no: label Low/Negligible and explain why.
Required Structure
1. Executive Summary (200–300 words)
Only include material risks.
Label each: High / Medium / Low / Negligible.
Highlight financial strengths that reduce risk.
If the balance sheet is robust, state clearly:
“Based on current evidence, financial risk is structurally low.”
2. Debt & Leverage Risks
Evaluate with proportionality.
Cover: net debt, cash, leverage ratios, interest coverage, maturities, fixed/variable split, leases, factoring.
For each:
What the risk would be in theory
Whether it actually applies today
Triggers that would make it real
Evidence from trends
If leverage is low vs cash & FCF, write:
“Debt risk is negligible: debt is small relative to cash generation and maturities are manageable.”
3. Dilution & Capital Allocation
Assess share count, SBC, buybacks, dividends, capex, and M&A.
Conclude only on real dilution or allocation problems.
If immaterial → say so clearly.
4. Liquidity & Cash Flow Resilience
Map cash buffers, FCF stability, WC swings, seasonality, concentration.
If liquidity is strong:
“Liquidity risk is low: strong cash position and stable FCF provide ample buffer.”
5. Covenants, Ratings, Counterparty Risks
Check only what exists.
If covenants are loose or irrelevant → label low.
If no meaningful counterparty risk → say so.
6. Scenario Table (Worst / Base / Stress)
Use realistic scenarios (no exaggerated crises).
Include: revenue, margins, FCF, debt sustainability, likelihood.
If the company is resilient, stress case should show resilience.
7. Early Warning Signs
Check for real deterioration (not theoretical signals).
If none:
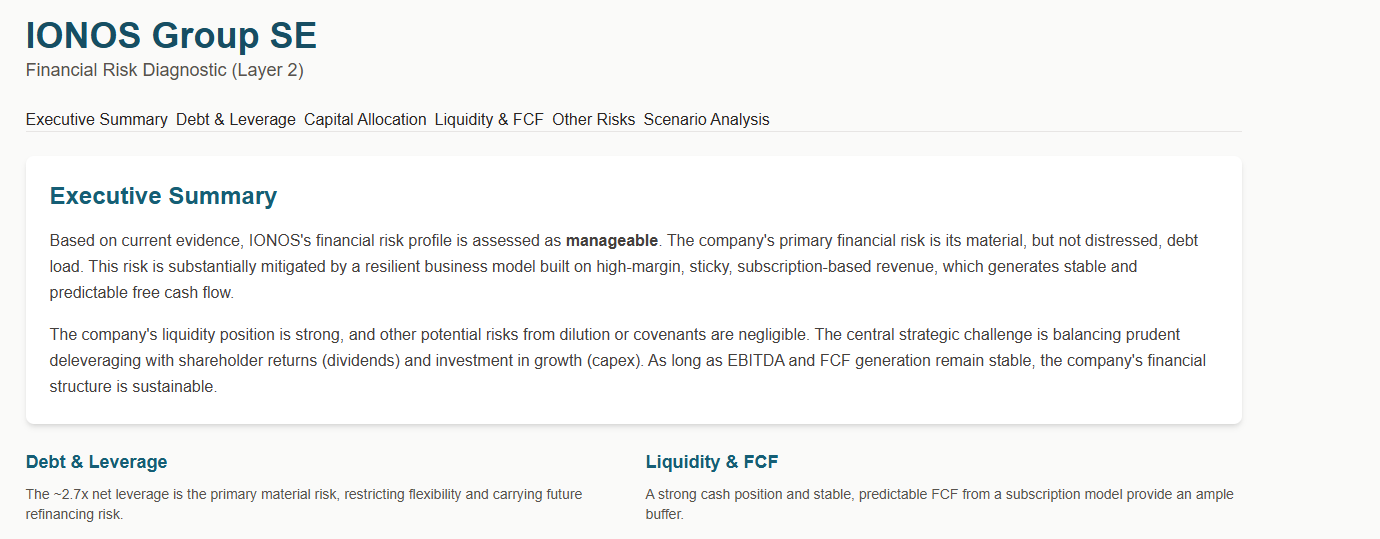
“No early indicators of financial deterioration.”I ran this layer on IONOS as well.
The results were clear: their financial risk is manageable, supported by a strong cash position, predictable subscription-based FCF, and no meaningful dilution or covenant issues.
Layer 3 : Structural & External Risk
After checking the engine (Layer 1) and the financial foundation (Layer 2), the final step is to look around the business at the external forces that can reshape its entire future.
Layer 3 answers the question most investors never think to ask:
“What happens if the world around this company changes?”
The prompt scans the long-term forces that can permanently shift a company’s economics:
Regulation (new rules, compliance costs, data constraints)
Technology shifts (AI, automation, platform changes, substitutes)
Industry power dynamics (competitor positioning, consolidation, pricing pressure)
Customer bargaining power (switching costs, alternatives, downmarket moves)
Geopolitical exposure (regions, supply chain, sanctions, trade friction)
Long-cycle demand trends (macro cycles, demographics, structural decline)
This layer matters because even a great business with a strong balance sheet can get hit by forces outside its control.
Prompt Layer 3 (Copy-Paste Ready)
You are an independent industry strategist.

Analyze the structural risk of this company: [insert your stock here]
Goal:

Produce a deep structural-risk assessment that explains how external forces (industry dynamics, regulation, technology shifts, customer power, supply power, geopolitics, long-cycle economics) could permanently impact the company’s ability to grow, maintain margins, or defend its position.
Instructions:

Build a structured, evidence-based analysis
Focus ONLY on external risks (not execution, not financials).
Identify the most realistic worst-case scenarios, NOT fictional collapse stories.
Prioritize: What could fundamentally reshape the industry or permanently alter future returns?
When relevant, use industry analogies or historical patterns to strengthen reasoning.
Your output must include:

Executive Summary

The 3–6 highest-impact structural risks, each with a 2–3 line explanation.
Industry Pressure Map

A clear read of:
competitor intensity
customer bargaining power
supplier/partner dependency
substitute threats
structural cost drivers
long-cycle demand trends
Regulation & Policy Risk
Current rules shaping the industry
Emerging or proposed regulations
What could realistically change in the next 3–10 years
The specific impact on this company
Technology & Disruption Scenarios
Which technologies could reshape economics or value capture
Adoption likelihood
Who benefits / who gets squeezed
Exposure of this company’s model
Geopolitical & Macro-Structural Risk
supply chain concentration
regional exposure
resource dependency
trade barriers, tariffs, sanctions
demographic shifts

Explain how each one could structurally affect growth or margins.
Signal Check

For each major risk, evaluate:
Is it already happening?
What early warning signals should an investor monitor?
Impact Prioritization

Rank risks by:
Likelihood
Severity
Irreversibility
Tone:

Direct, analytical, high-clarity.

No fluff. No generic MBA filler.

Every section must help an investor understand long-term, structural fragility.
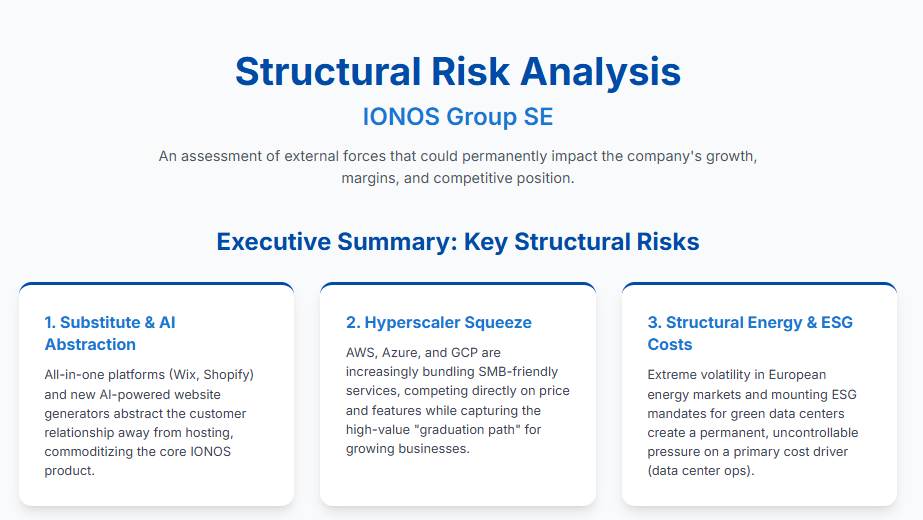
I ran this layer on IONOS too.
Gemini highlighted 3 structural forces: AI substitutes, hyperscaler pressure, energy/ESG costs.
Long-term shifts that can reshape the business.
Recap : The 3-Layer Risk System
Today we saw 3 prompts to get, in 30 minutes, a complete risk map of any company:
Layer 1 : Inside the Business
You check the engine: customers, margins, unit economics, moat.
Question: Is the core business strong… or quietly cracking?
Layer 2 : Behind the Business
You check the foundation: liquidity, leverage, cash flow, dilution.
Question: Can this company survive stress… or does one bad cycle break it?
Layer 3 : Around the Business
You check the world: regulation, technology shifts, substitutes, geopolitics.
Question: What happens if the environment changes?
Note :DeepResearch mode is required for these prompts to work correctly.
I use Gemini because it’s the strongest right now, but you can use any LLM that supports a real deep-research mode.
Share this with your investor friends and help them add AI to their process
Using AI to spot blind spots in risk assesment is a smart workflow. The 3-layer breakdown makes it actionable. Most investors either ignore risks completly or overreact to irrelevant ones. This helps separate signal from noise.