
90% of Stock Losses Are Avoidable (If You Do This).
3 prompts I run before every investment.

November 18th, 2025.
A message drops in our investor group.
The kind you read twice hoping you misunderstood
“Intellego’s CEO has been arrested for fraud.”
I didn't own the stock.
But several friends were.
Some of them are experienced investors with 10+ years in the market.
Smart people.
Doing real work.
Still caught in a fraud.
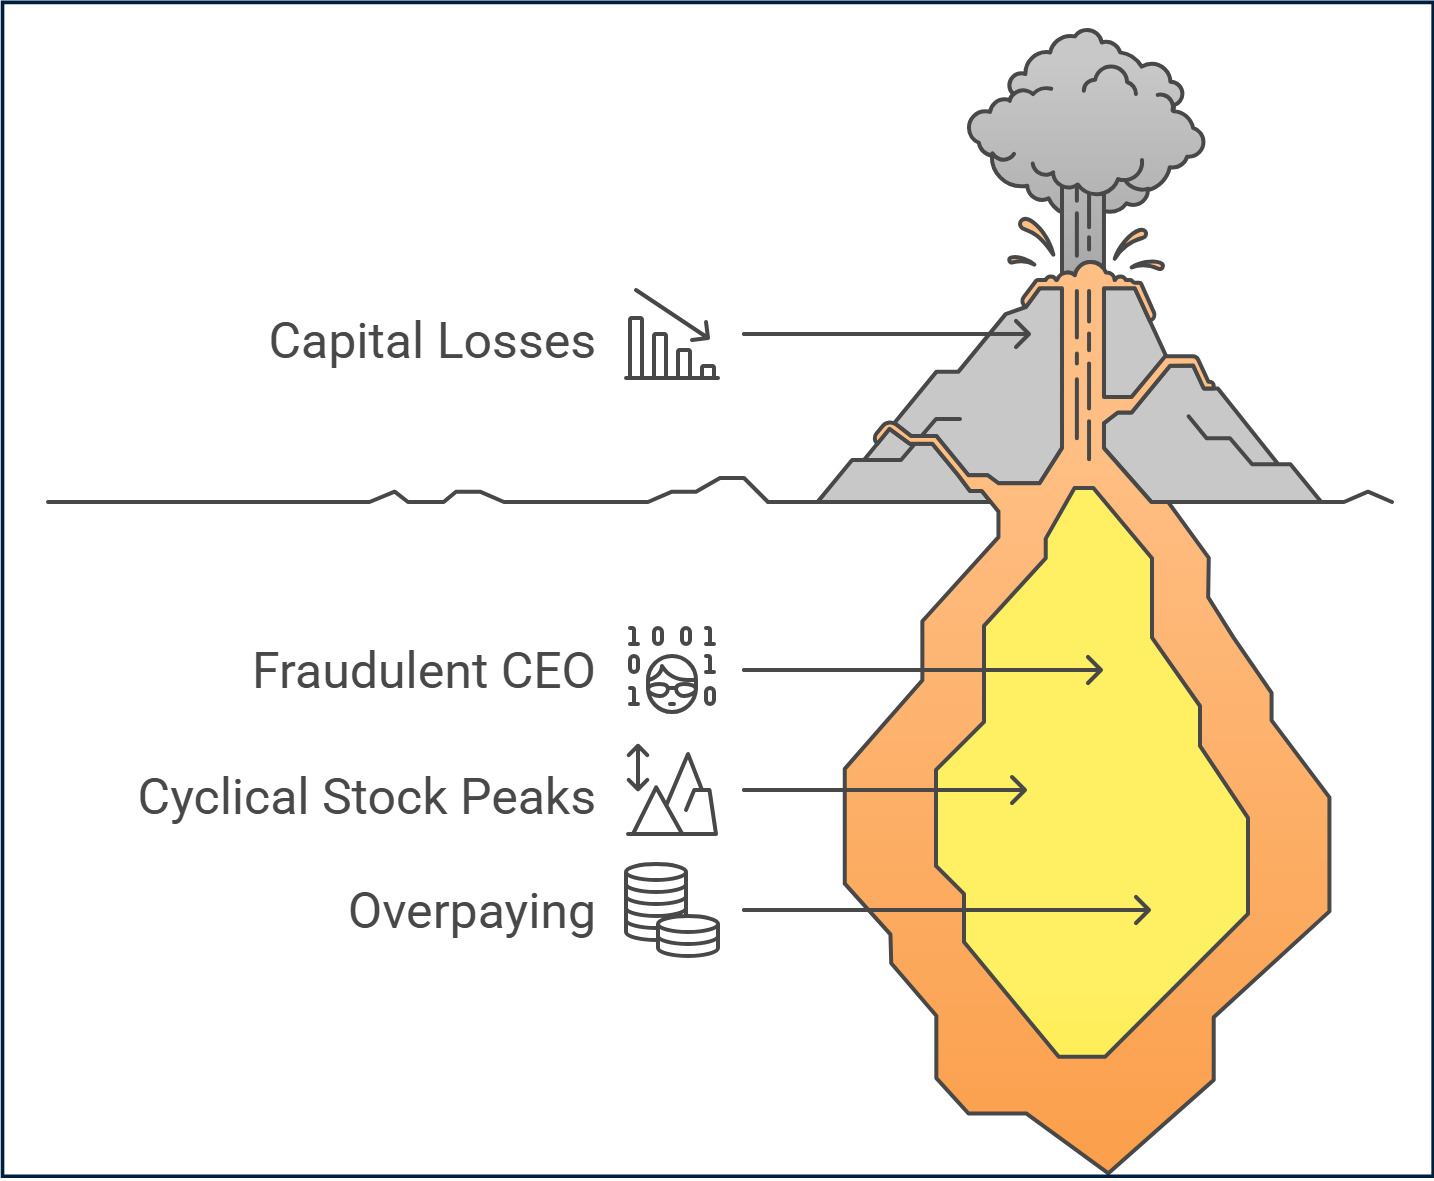
Fraud is one way to lose everything. But it’s not the only one.
After years in the market, I keep seeing the same 3 causes behind every permanent loss.
All are avoidable:
You’re invested in a fraud or a company heading for bankruptcy.
You bought a cyclical stock at peak earnings.
You paid way way too much for a good business.
Screen for these 3 before you buy, and you avoid the vast majority of permanent capital losses.
The problem?
Doing this manually takes hours…
AI changes that.
It runs these checks in minutes and catches blind spots your own bias would miss.
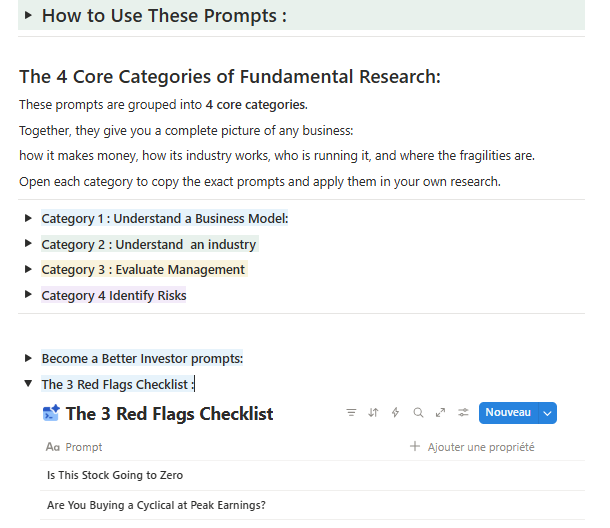
I call it The Capital Killer Checklist.
3 prompts.
Each one destroys capital in a different way.
Let’s break them down.
Note:
I run all prompts in DeepResearch mode.
In your favorite LLM ( today, Gemini ranks best in my tests for deep analysis)
Been around? You already know why DeepResearch.
New here? I explained why DeepResearch matters in this article:

#1: Is This Stock Going to Zero?
Some companies are lying to you.
Some can’t make money without borrowing or diluting every year.
Some have real businesses, but the have debts they’ll never be able to repay.
3 diffrente problems.
Same result: you lose everything.
This is the first test I run. It screens for all 3:
Signs of fraud: Are there red flags in public filings or management behavior that don’t add up?
Broken business model: They can't generate cash without raising debt or issuing shares
Debt sustainability: free cash flow and assets can't cover what they owe.
Run this prompt to have the answer(Gemini Deep Research):
Role

You are a forensic accounting + credit risk analyst writing for a professional investor.

Target

[Company Name]

Goal

Using verifiable sources only, assess:

Fraud / manipulation risk

Broken business model risk (can it generate real FCF without dilution/debt?)

Debt sustainability risk (can FCF/assets support debt, or is survival refinancing-dependent?)

Be skeptical but fair. Flag issues only when supported by evidence.

Sources to Use

Annual reports, quarterly filings, footnotes, cash flow statements

Debt notes / covenant disclosures

Official earnings call transcripts

Regulator records (SEC / AMF / FCA), exchange announcements

Company press releases, court/litigation filings

Insider trading filings

Credible financial news, broker research

Short-seller reports (claims, not proof)

Mandatory checks (search if not in filings)

Auditor changes / qualified opinions / going-concern warnings

Regulatory actions (SEC, AMF, FCA, etc.)

Major lawsuits / investigations

Insider buying/selling activity

Credible short seller reports (if any)

Debt maturity schedule / refinancing events

OUTPUT FORMAT
0) Investment Summary (start here, max 10–12 lines)

Overall Risk Rating: GREEN / YELLOW / RED

Most likely failure mechanism (1 sentence): what breaks first?

Top 3 red flags (each with evidence)

Top 2 stabilizers (each with evidence)

Final verdict (one line): SAFE / INVESTIGATE FURTHER / AVOID

1) Risk Dashboard (table)

| Area | Rating | Severity (1–5) | Probability (1–5) | Key evidence |

Areas:

Accounting & reporting integrity

Quality of earnings (cash vs profits / working capital signals)

Business model viability

Balance sheet liquidity

Debt maturities & refinancing dependence

Governance & insider behavior

Legal / regulatory risks

2) Quality of Earnings Quick Scan (MANDATORY)

Check these traps and report only meaningful issues:

Net income vs CFO trend (persistent gap?)

Receivables vs revenue (A/R rising faster than sales? DSO rising?)

Inventory vs sales/COGS (abnormal inventory build?)

Recurring “one-time” items (restructuring, impairments repeating?)

Reserve manipulation (bad debt, warranty, inventory write-downs?)

Capitalization behavior (costs shifted into capex/intangibles?)

Working capital explanations (repeated “timing” excuses in MD&A?)

For each issue provide:

Finding

Evidence (page OR link + date)

Why it matters

Severity / Probability

3) Core Findings (evidence only)

For each area, include only meaningful signals:

Finding (1–2 lines)

Evidence (filing + page OR link + date)

Quote (1–2 lines if possible)

Why it matters (mechanism, not theory)

Scores: Severity / Probability

What to monitor (1–3 concrete indicators)

No generic risks.

4) Required Financial Reality Check

Using the most recent data, report:

Net debt

Net debt / EBITDA

Net debt / FCF

Interest coverage

Current ratio + quick ratio

Free cash flow trend (5Y)

Working capital trend (5Y)

% goodwill & intangibles of total assets

Debt maturity schedule (next 3 years)

If missing: Not found / Not disclosed.

5) Debt Sustainability Assessment (key investor questions)

Answer clearly:

How much debt could be covered by 3 years of normal FCF?

Is the company dependent on refinancing? If yes, when does it become critical?

Are covenants disclosed? If yes, how much headroom exists?

If refinancing tightens, what is the first pressure point?

6) Ranked Outputs (mandatory)
Top 7 Red Flags (ranked)

| Rank | Risk | Severity | Probability | Evidence | Early warning trigger |

Top 5 Stabilizers

Evidence-based factors reducing downside risk.

Falsification Checklist

List 5 concrete developments that would materially weaken or invalidate the bear case.

Rules

No invented facts.

If a claim cannot be sourced, write: “Not found in provided sources.”

Do not invent page numbers or citations.

If using filings: cite document name + page.

If using web: cite source + date.

Separate Fact vs Inference clearly.
The results will point to potential risks like this one:
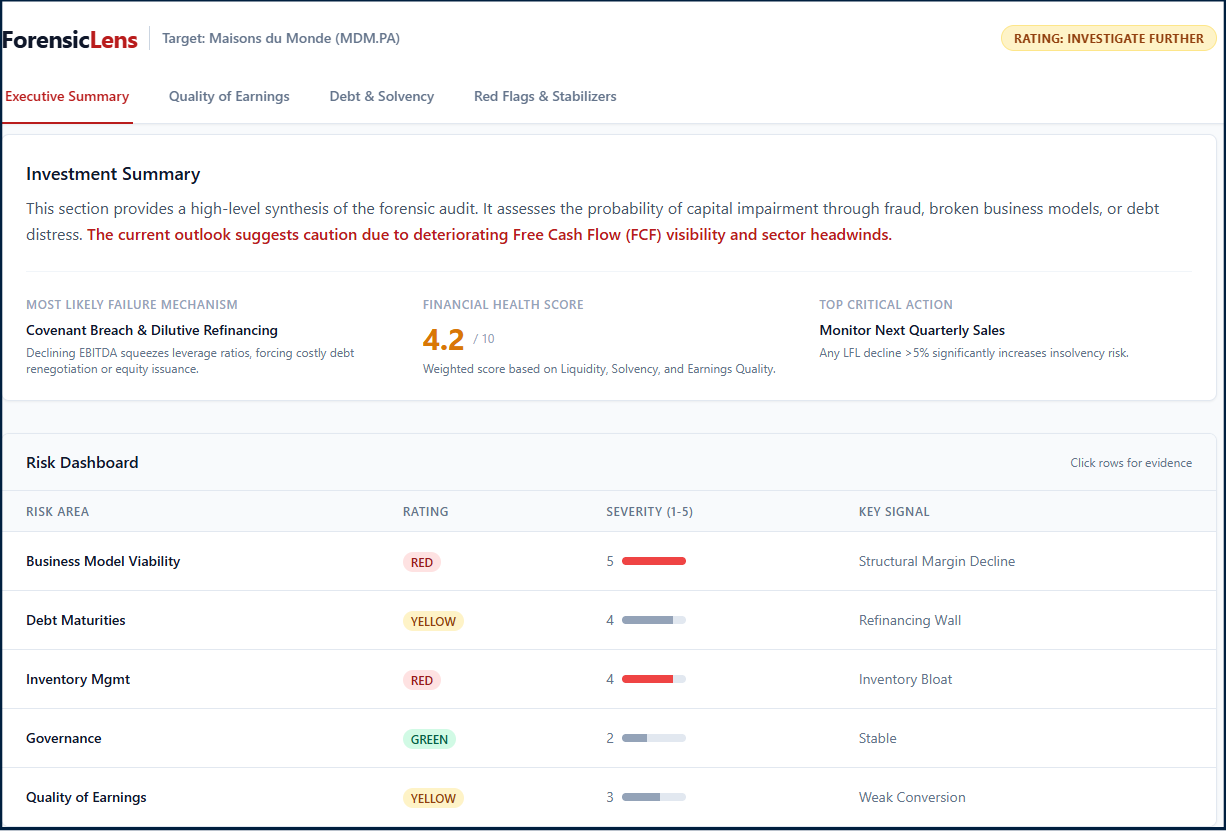
The goal isn’t to give you a final answer.
It’s to surface the specific points you might have overlooked , so you can go deeper where it matters.
This is a fast check, but an important one.
And what’s better than an AI that reads 200 pages of filings... before you even open the first one?
#2: Are You Buying a Cyclical at Peak Earnings?
This one is sneaky.
You look at a stock and see a P/E of 5.
Looks cheap, right?
It’s not.
The earnings are at a cyclical peak.
Next year, they could drop 50–70%.
That “cheap” P/E of 5 becomes a real P/E of 30 or 50 once earnings normalize.
This is the cyclical trap.
It catches investors every single cycle.
Commodity producers, shipping companies, auto suppliers, chemical companies, construction stocks.. all of them look cheapest right before they crash.
What happens:
Earnings peak → Stock looks cheap on trailing P/E
Cycle turns → Earnings collapse 50-80%
Stock drops 80-90%
You lose money even if the business survives.
The prompt below helps you spot it before it’s too late.
(Like all prompts in this article, it’s already in the Prompt Library , free for paid subscribers)
Here is the prompt to run in Gemini Deep Research: